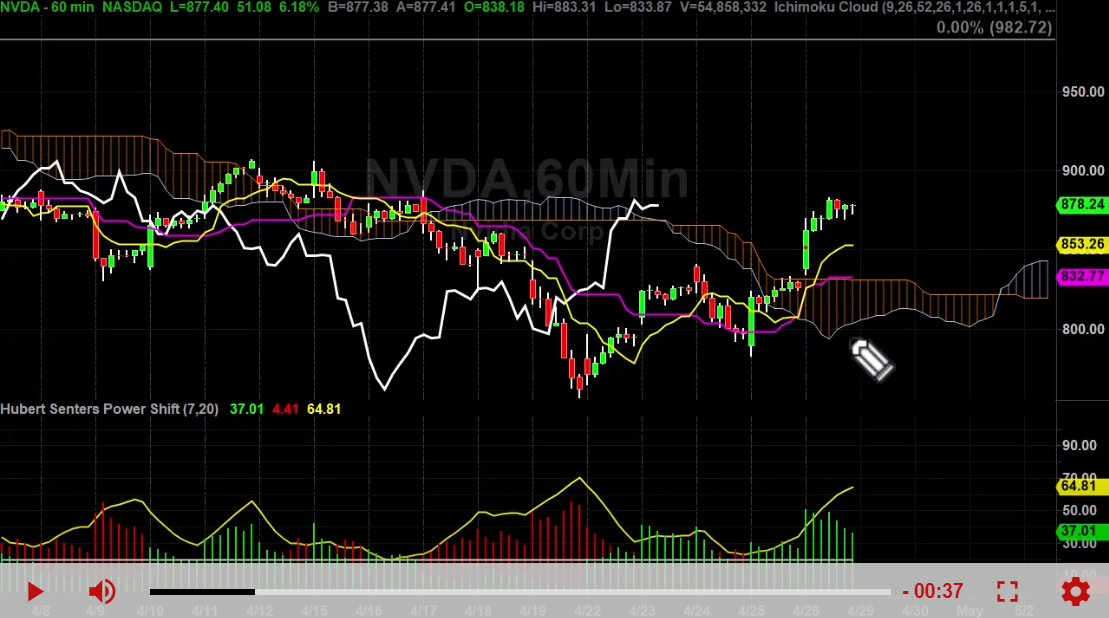
Hubert Senters here.
Let’s take a look at the 10 minute picture of the bonds and in particular we’re going to look down here at these dots. They’re just called Ichimoku signals which is what I’ve done is I’ve simplified a way of looking at Ichimoku. I like three different time frames daily, hourly and 10 minute. Those are my preferred. They’re now better than anything else. Pick your own time frames and learn how to work with them. Those are the three that I like. So here’s how it works.
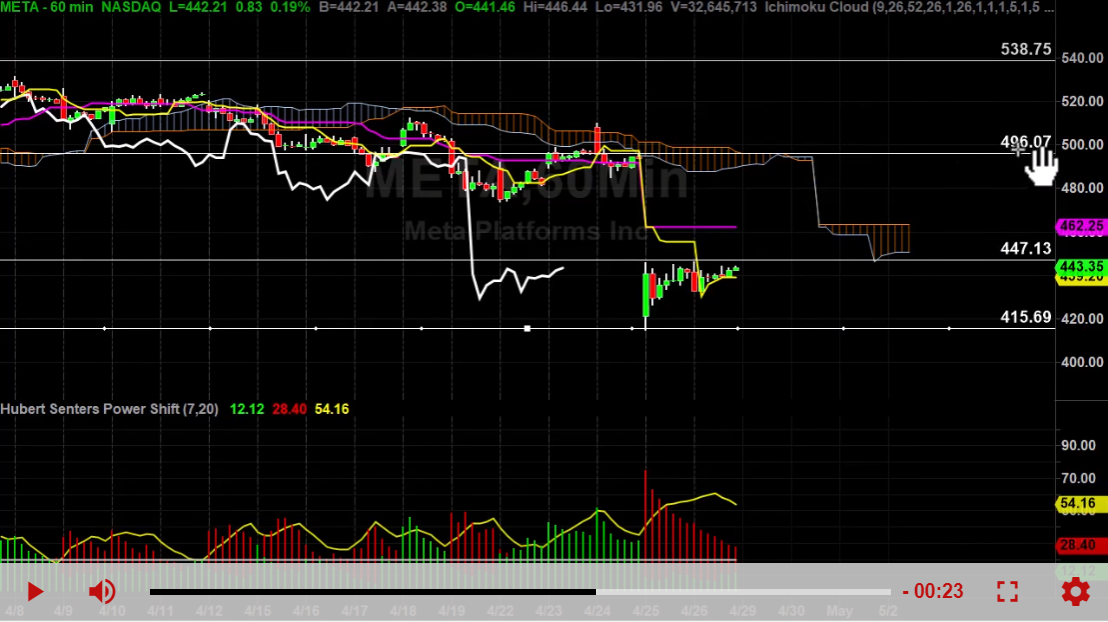
So if you’re an Ichimoku fan the big green dot is telling me it’s above the cloud on the daily, the medium term dot in the middle for me is a 60 minute time frame. And the small little itty bitty dot right there is a 10 minute time frame so I can know at a glance and I only have this on a smaller time frame. I can’t put it on larger time frame so my smallest time frame is the time frame I have to put it on. That’s fine.
So I don’t want to sit around and just look at charts all day long. I can just look at the 10 minute go oh, 10 minute sell, 60 minute sell, daily still above the cloud and I shouldn’t call it traffic light or something like that or trading confirmation. I couldn’t think of a real sexy name. I’ll work on that in the future. Don’t worry. But just call it the Hubert Senters Ichimoku signals.
And as you can see right here daily above yellow means it’s in the cloud which is a no go, right and then green. And ideally, what you want is you want all three of these suckers to line up if you can get it that way it’s going to increase your percentages of a profitable trade right now. You can see up in this area here it was sideways because in the middle of the night with all three green.
But what you’re looking for is the green on green or the red on red to let you know which directions. And now, I’m going to show you what that looks like real quick. So this is real time so now you can see I’m talking about the daily chart is on your left here. It is still above the cloud. Now, it’s pulling back the 60s in a sell so daily green above the cloud. 60 Minutes below the cloud red and the 10 minute is also below the cloud so what I will be looking for is for this first little itty bitty 10 minute green dot to go green or red dot to go green and then I know I’ll have a 10 minute buy signal at that point.
And then it’ll bounce from here all the way into the bottom of the cloud then this one will also turn green and then I’ll know the 10 is above the cloud. And now the 60 is above the cloud and then I can start re-thinking aggressive on the long side. This indicator comes with the bond trading boot camp which I’m going to be doing Sunday at 6PM EST. The only way you can get this indicator is by attending the bond trading boot camp at this particular time 6PM EST.
It’s going to last for about two and a half three hours. Don’t worry we’re all still be able to watch Game of Thrones on Sunday so I’m going to HYPERLINK you over to an order form and put it in your payment details there and I’ll see you this Sunday at 6PM EST.
Good luck. Hope it helps. And I’ll see you on the next video.
Hubert.
