Hubert Senters here.
Now, that we have established a basic working knowledge of some of the stuff that’s on the chart. There’s couple scans I recommend you do.
Number one, I would scan for newly above the cloud or newly below the cloud. Different platforms handle this different way.
I’m going to show you how it’s done on Trade Station. And I’m going to show you how it’s done on wealth charts.
Some platforms are easier to deal with others. Not every platform will have the ability to scan like this. TOS you have to build. I think you can build scan but it’s a little more difficult but it still can be done. It’s a little more steps.
So in Trade Station is pretty simple. So I’m going to move my camera over here. So it’s going to look a little weird at first.
And then this chart is going to be hyperlinked to those scans. So with really two clicks of a mouse on Trade Station since I’ve got load into radar screen. I can just double left click and you can see new below.
And here’s why I’m doing this. I’m doing this up here. Radar screen is basically like excel on crack or on steroids.
So I’m just going to go double left click and you can see new below, new above. That’s the information I need.
So you can where this one if it’s Maceys. This one is new below the cloud and the ADX is $18.33. I don’t want to do it if ADX is below $20.
So PDCO is also not going to qualify for me. Amazon not going to qualify even though it looks like a good long the ADX is not at $20 so I prefer to have it at $18 going towards $20.
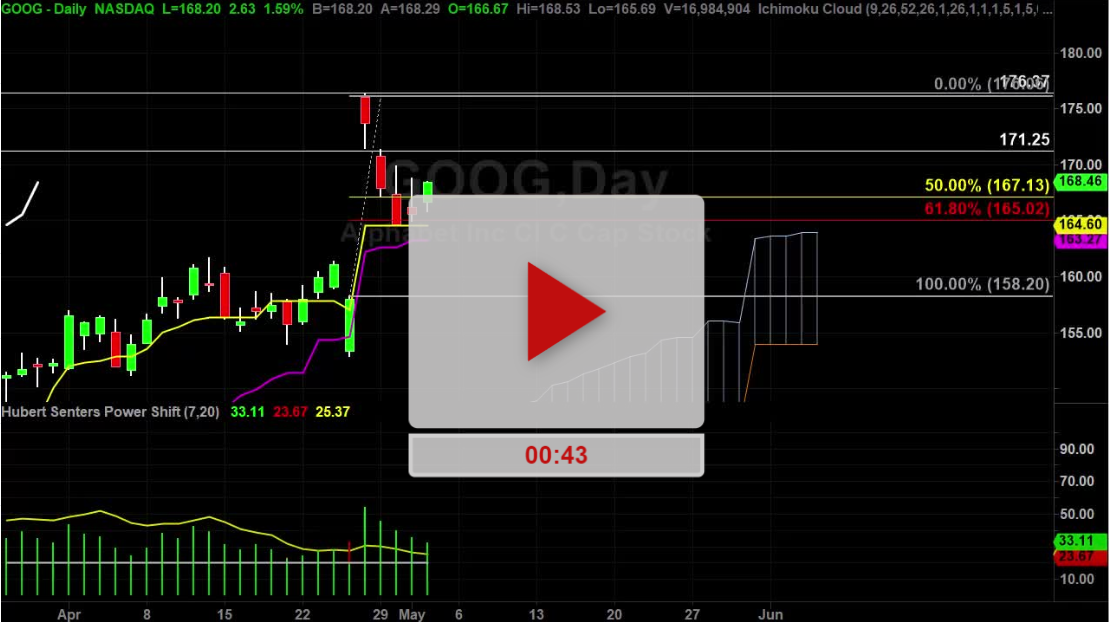
On Amazon, you could probably make that work. So in short order I can pretty much go down here to AWK and say it’s trending and it’s one day above the cloud so it will probably continue higher.
Now, I would think. This is what I think about. One day is in aggressive mode. Two days is moderate and three is conservative. So depending on your trading personality.
One day if you’re super aggressive. Knock yourself out. If you’re more conservative wait for two days and if you’re really conservative wait for three days so here’s more trades.
EA, potential long right there. Humana, potential long right there. ADX is above $20 and then JWN potential long there. And then here’s the potential new above new below.
So that’s new below, new below. That one’s new above. Pretty simple. Now on wealth charts it’s handled slightly different. I’m really good friends with Rob so they’ve built me a really good Ichimoku scan over there which you guys if you’re wealth chart member you guys can have access to it.
So what I’m going to do is I’m going to scan. First, I’m going to use this filter. I’ve got all of the stocks. I can potentially go down here and do a drop down and I can scan.
Let’s say anything in the S&P 500 stocks. And then I’m going to use the filter so I’m going to use drop down S&P 500 and then drop down filter greater than. I want the price greater than let’s say $10.
I want the ADX to be greater than let’s go $18. The price location I want it new above cloud. And then I would just hit the update down here apply filters.
And it will do a little bit of work in the background and then it will spit out if we have potential trades with that filter right here. There we have two.
So we’ve got EA. There’s EA a potential long. And there’s TER that’s also potential long. So let’s go back and filter another way. I can go down here and filter new above cloud.
So now, I’m going to go new below cloud and then I can hit apply filter and here you can see we got ETSY so ETSY is a potential short and there’s what ETSY looks like as a potential short.
You can see the ADX is $20. New below cloud. 1 bar. Now, if you want to filter for different days you can. You can say new above or below the cloud. I’m going to remove all the filters again. I’d just say I’m going to remove all filters.
The only one I’m going to leave on here is greater than equal to $18 on the ADX and then I’m going to let it do its work and that will spit me out a bunch of different stuff on if I’m looking for another no price action.
So here you can see new above the cloud above 21 days, 15 days, 18 days. So if you’re more conservative you can come down here to three days above the cloud.
There’s your one to three days above the cloud. Here’s Kreuger three days above the cloud. Here’s KEYS three days above the cloud. If you want to go five days. Here’s five days above the cloud. So that’s how you do that stuff.
Hopefully that helps you get an idea of how you can set up a structured routine or habit to make finding trades kind of fretching less.
I’ve been invited to speak at the Wealth 365 event. I’m going to show you exactly how to do this in more in depth detail. I have 45 minutes to about an hour to talk to you about this stuff.
And then I’ll show you how I filtered the trades and how I rank them and how I pick the ones that I want to trade for the next day. If you’re interested in attending that webinar I will HYPERLINK you to this page.
Good luck. Hope it helps. See you on the next video.
Hubert.

3 Comments
Hi Hubert,
Please excuse me for my extreme ignorance. Can you please advise me how to set up the properties in the scanner on TradeStation, ie the left column? I am very new to this and need all the help that I can get. I look at you daily emails and find them very educational. I have also purchased one of your products.
With the kindest of regards,
Richard
How do you do it for TOS or TWS? Thanks.
How can we scan for bond and note trades?