Hubert Senters here.
Hey this is Mark covering again for Hubert who is traveling this week continuing from my video yesterday talking about this really powerful strategy that Hubert got from his contacts in the forex world.
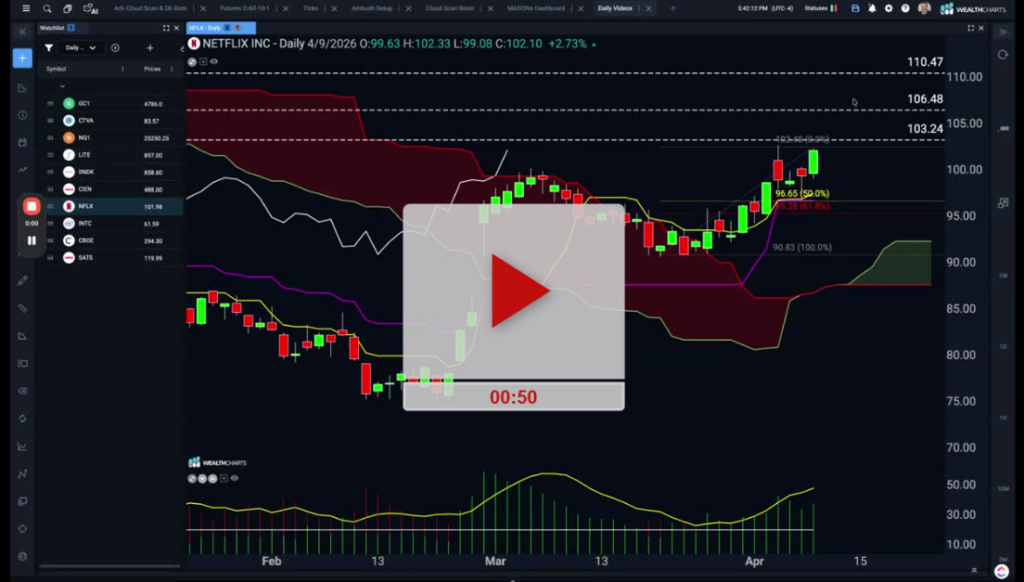
They were using it to trade forex markets and doing very well with it from what we heard. We tested it ourselves and sure enough it turned out to be really good strategy. So reviewing just recapping yesterday the open on Monday was right here and you can see that prices quickly sold off to the solid red line here which is the sell signal.
And then shortly thereafter we had profit target one right here the first dashed line that profit target two shortly thereafter and then fell off even more all the way through the close on Monday. So that’s how the strategy work.
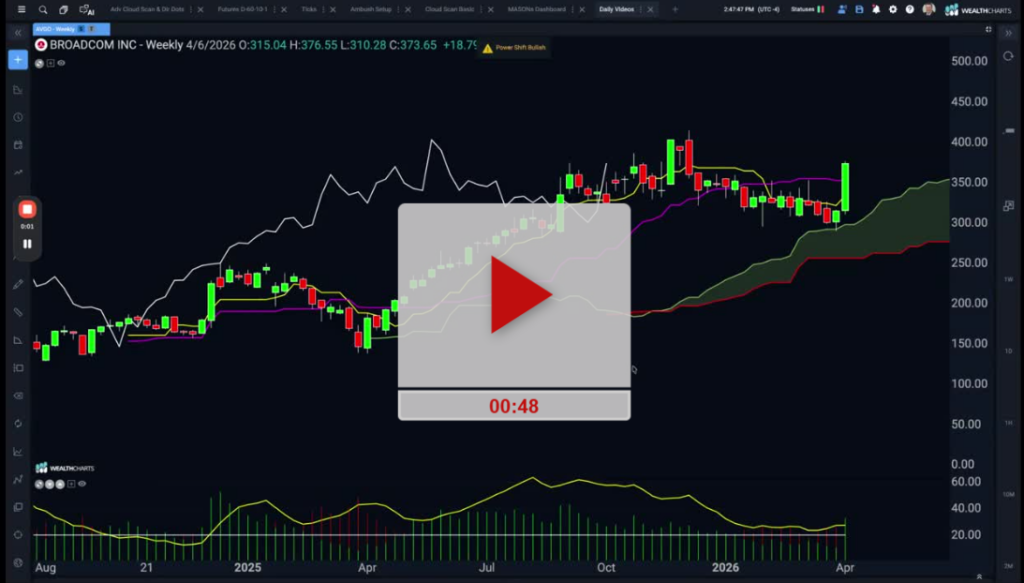
The thing that I was going to show you in today’s video is this indicator where we color the bars red or green. Now, this is really cool, this is called the top. This is called the top tick trader. And this is a great tool from toptradetools.com.
It is designed to read the market sentiment if you will. The NYSE tick data and it’s designed to detect either net selling or net buying on the New York Stock Exchange.
You can see it turn red near the end of last week indicating that selling was coming into the stock market over and beyond the buying so selling power was actually the dominant force. And sure enough heading into Monday.
We had read price bars and then you can see we should have been looking for right out the gate I should say should be looking for the short signal which came shortly after the open and then we know the rest of the story was a very nice short signal, very profitable worked like a charm for Monday’s open.
But a great way to combine two different trading tools very different and increase your odds and theory of identifying winning trades. So very cool concept. I love the one two punch here approach. Now turning our attention to IBM. IBM as a stock you may want to keep an eye on here.
It is in the midst of a pennant pattern. You can see here we’ve got a fairly well-defined trend line on the top here on our weekly chart and we’ve got one here in the bottom now. We did penetrate down through that but it didn’t hold up so keep an eye on this.
We are expecting a cycle peak here if we break down through this trend. This bottom boundary line and get it closed below that we could see prices start to really fall off here. So it’s been a consolidation coiling up for a big move either to the downside or upside which remains to be seen.
So a failed signal to the downside would be very telling or a confirmed signal to the downside would be equally telling. But keep an eye on IBM right now because it is testing the lower bound your line.
Thanks for watching. And as always good luck trading.
Mark.