Hubert Senters here.
In the last video, we were talking about Ichimoku cloud and where all the pretty numbers and the lines were and we’ll make it a little bit simpler and easier for you.
I’m going to describe everything in this video. In the last video, we talked about it’s good for up or down moves for new trends or established trends. Let’s go back through that.
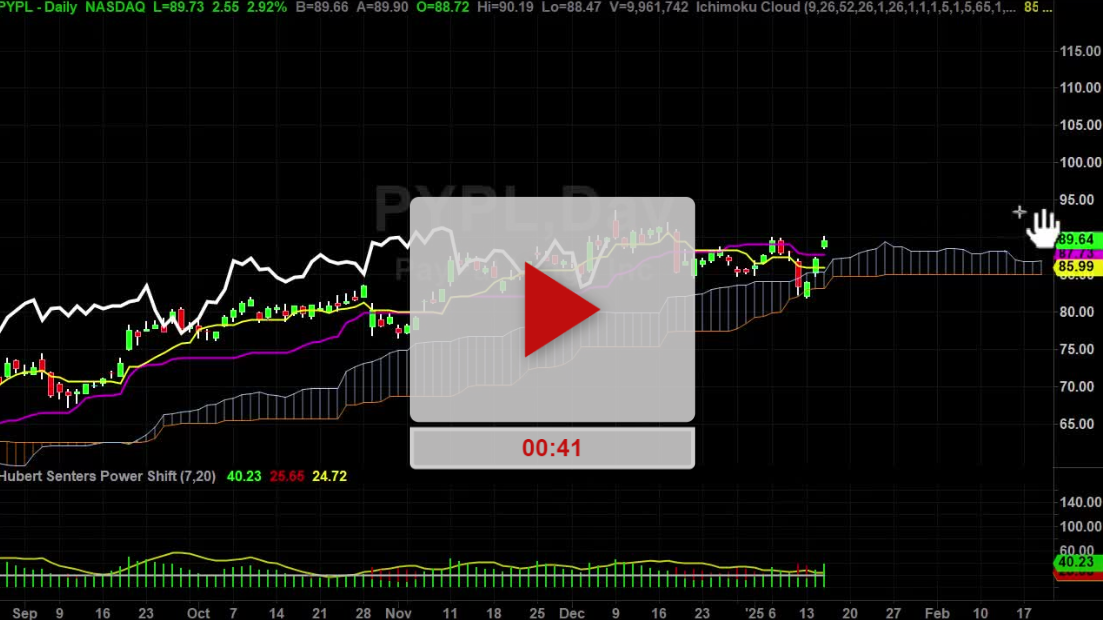
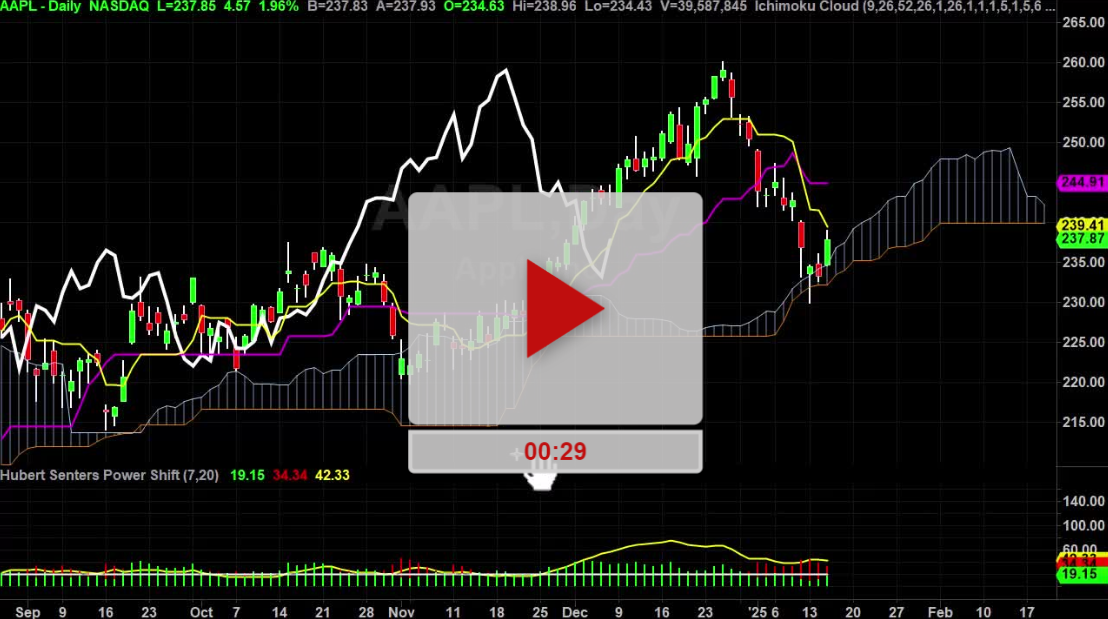
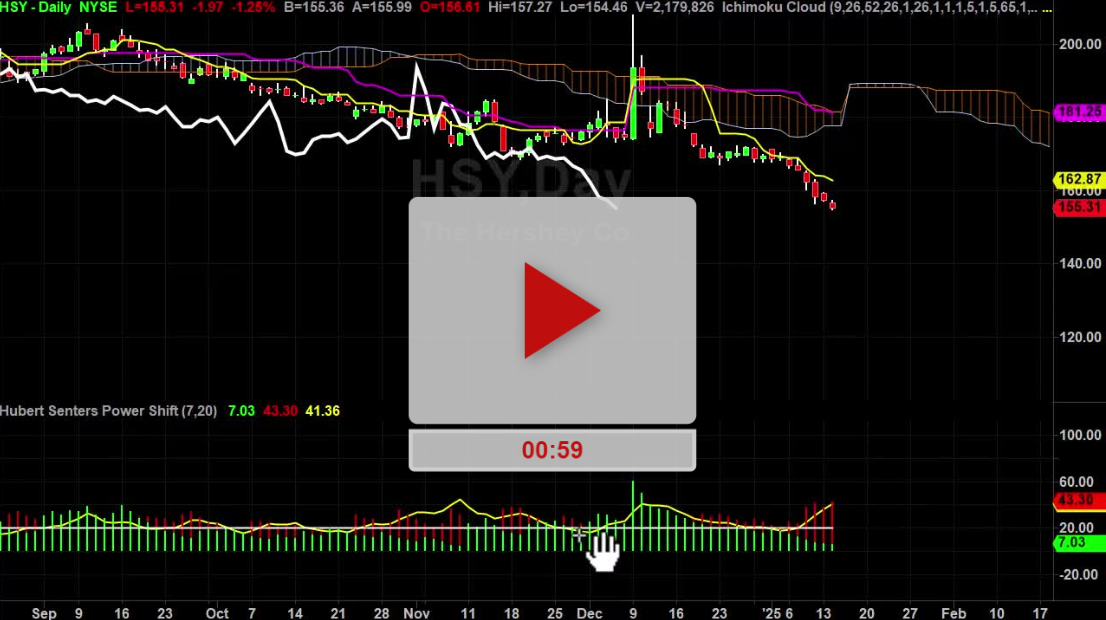
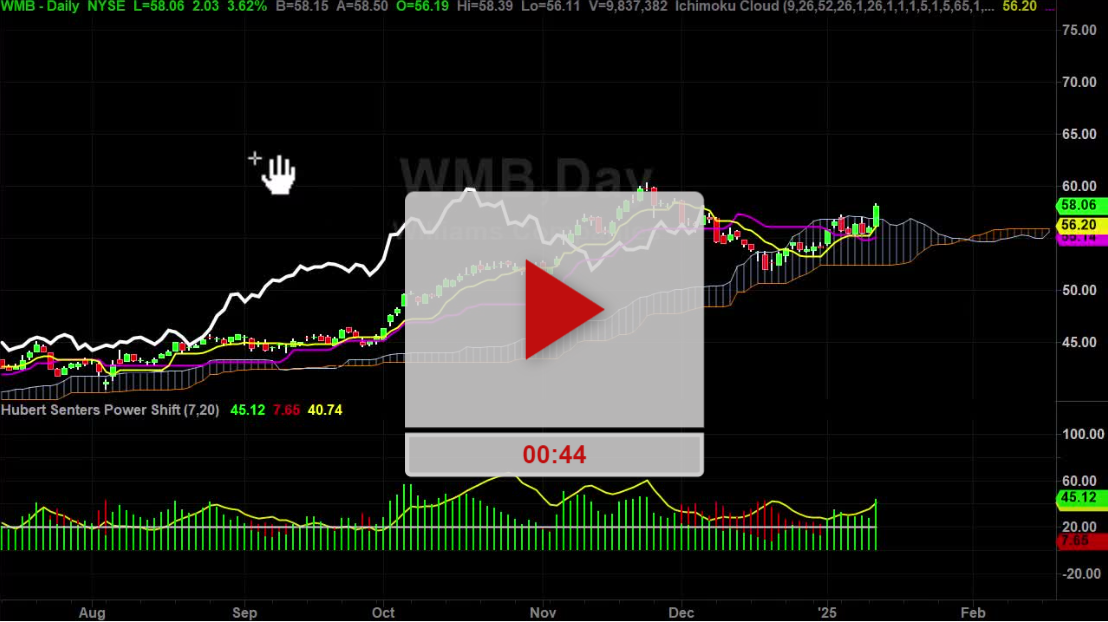
A new trend is going to be one to three bars above the cloud or one to three bars below the cloud. So if it’s one to three bars above the cloud obviously, you’re going to get long and try to stay long as you can.
And then if it’s one to three bars below the cloud you’re going to get short and try to get as short as you can. Now, the white line is the lagging line. It’s not that important so I wouldn’t pay attention to the white line initially.
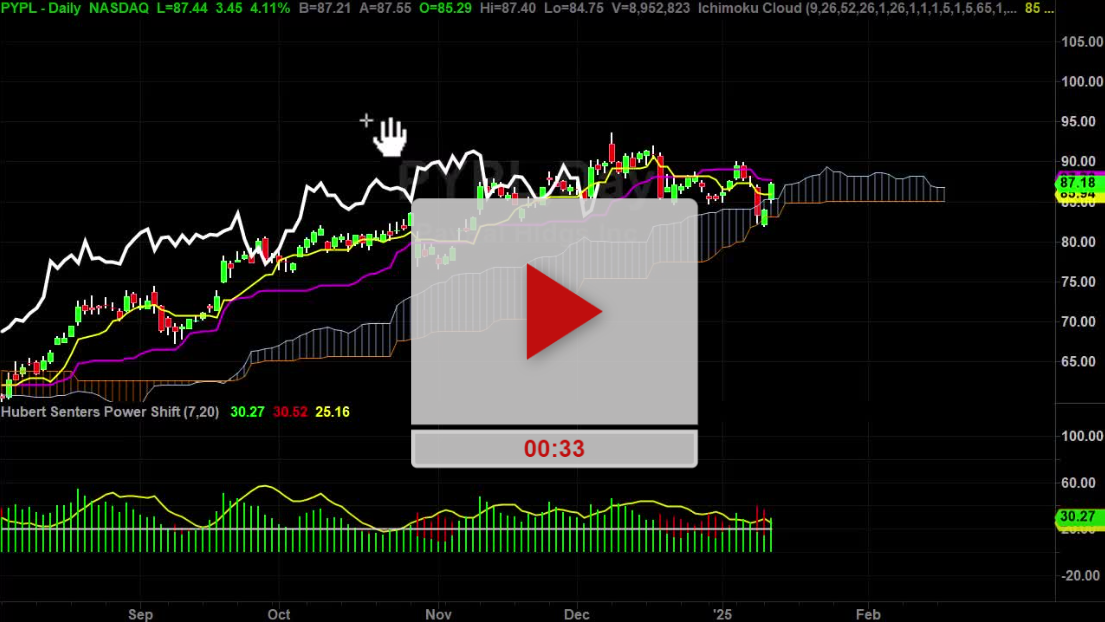
When you’ve got a brand new trend like down here where we’re starting out you can see that it’s going to respect the yellow turning line which is a 9 period midpoint average.
It’s not a moving average. It’s calculated slightly different. So as it’s going up it will come down here and it will tag yellow and then go back up. And you can see for the most part for the first, I would say two or three months of this move it respected the yellow line a lot to turning line.
In some cases it will break the turning line and then go to the standard line which is a 26 so there’s a 9 and 26. 26 period midpoint average moving average.
So that’s why I’m calling the yellow line the fast line and the purple line the medium line and then the cloud either the top of it or the bottom of it is going to be considered slow support.
So if it breaks the yellow, it’s going to the purple and then all you have to wait is for it to back above and then that’s going to be a trade to the high side.
Once again, it goes back to respecting the yellow line and then down here it fails and then now it’s lower over head resistance and now it’s trying to figure out.
What it’s going to do is it’s probably going to head to this slow support or this slow support. So one of the tools that I like to use to let me know whether to trade this or not is at the bottom of the chart.
It’s called an ADX. This is just an Average True Range and both of these indicators are freely available on all godo trading platforms out there. It’s just called the Ichimoku cloud.
This is how you spell it because I know I’ve got a thick accent, ICHIMOKU cloud and then down here it is called the ADX.
Now, how you use the ADX as long as this green line. That’s our threshold line. If the line above the threshold line is yellow that means this is in a trending environment.
If the yellow line turns red and goes below the green line down here that means we’re in a non-trending environment so down here you can see that this the just chart of Goldman Sachs.
I would stay away from Goldman Sachs as the red is below the green but as soon as it creeps back above, the yellow goes above or the red line goes above the green line and turned yellow and this is going to be more of a trending trade.
Same type of situation here. You can see it’s had a nice run up and now, it’s going back into non-trending mode.
I’ve been asked to be one of the guest speakers at the Wealth 365 online event. I’m going to show you how you can find trades like this if it’s little as three clicks of your mouse.
In order to register for the webinar first name, email address and optional telephone number.
Good luck. Hope it helps. See you on the next video.
Hubert.


1 Comment
Hi Hubert,
I’m on TOS
Why does my cloud have two different colors?
One’s a puke colored yellow and the other’s a depressing shade of red
When I look at it in “Edit Studies” it only shows one color, a red
Thanks, Tara