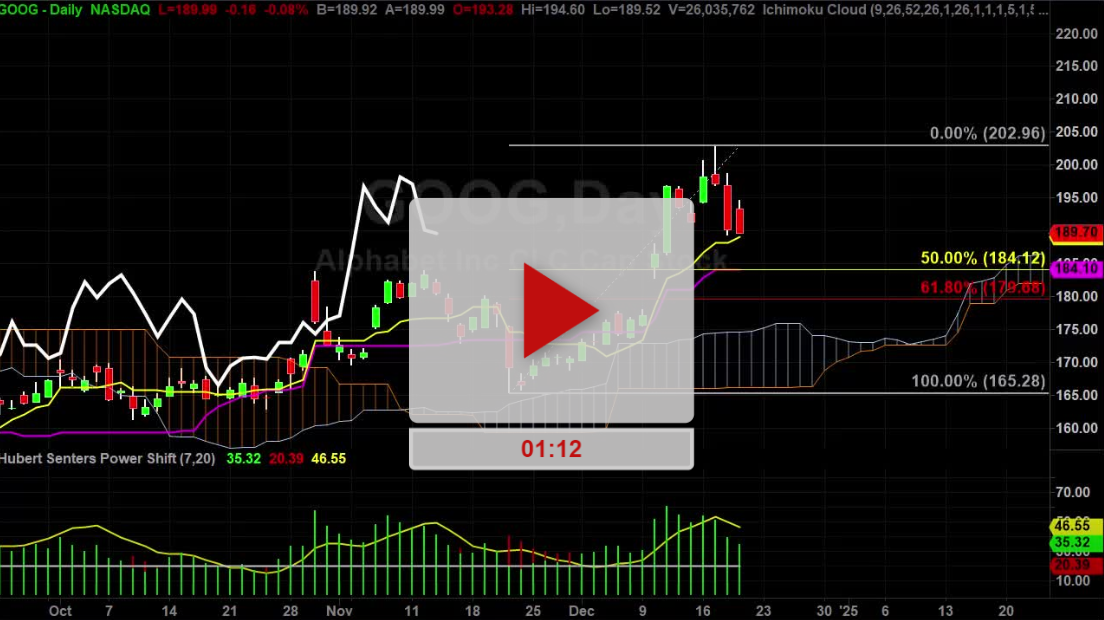
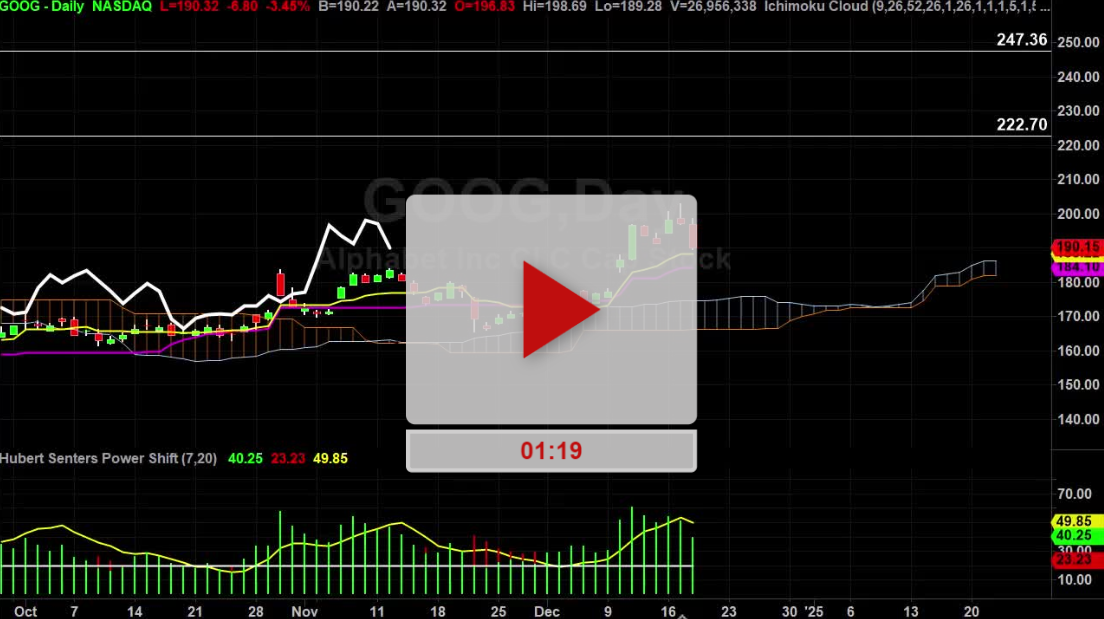
Hubert Senters here, let’s take a look at Google ticker symbol G O O G. And as you can see, Google is having a nice run and actually stronger than the regular the rest of the market. This is a monthly chart of hockey stick since 2020. Here, then you go back down to the daily chart, because most of these videos are for swing traders more than they are day traders, right, because you’re going to be in them for a minute. But we also day trade around here. But as you can see a nice little pattern here is going to be very easy to get a low here, a high here and a higher low. So if it breaks out tomorrow above that most recent little high around 2969, it’s probably going to hit to these highs around you know 3000 ish and then To infinity and beyond. So let’s see if we can get a nice little edge here for a target so that makes sense. 2995 or around 3000 For the first target 3115 3235 and 3309
I’m going to be doing a webinar tomorrow night on how I like to time trends and trend reversals and the title of the webinar is the mother of all bubbles because I don’t think we’re out of the woods yet I think we are setting up to absolutely get destroyed to the downside anywhere from a 14 to a 40% retracement hasn’t happened yet. If the gave a couple of little head heads up then it might want to do that and then it goes back up so it’s in the process of filling it aren’t am I gonna do it now? Or am I gonna wait a little bit longer? Am I gonna do it now? Or am I or am I gonna wait a little bit longer? I’m going to hyperlink to this registration page so you can learn how I time that stuff.
Good luck. I hope it helps. I’ll see you on the next video.


0 Comments