Hubert Senters here.
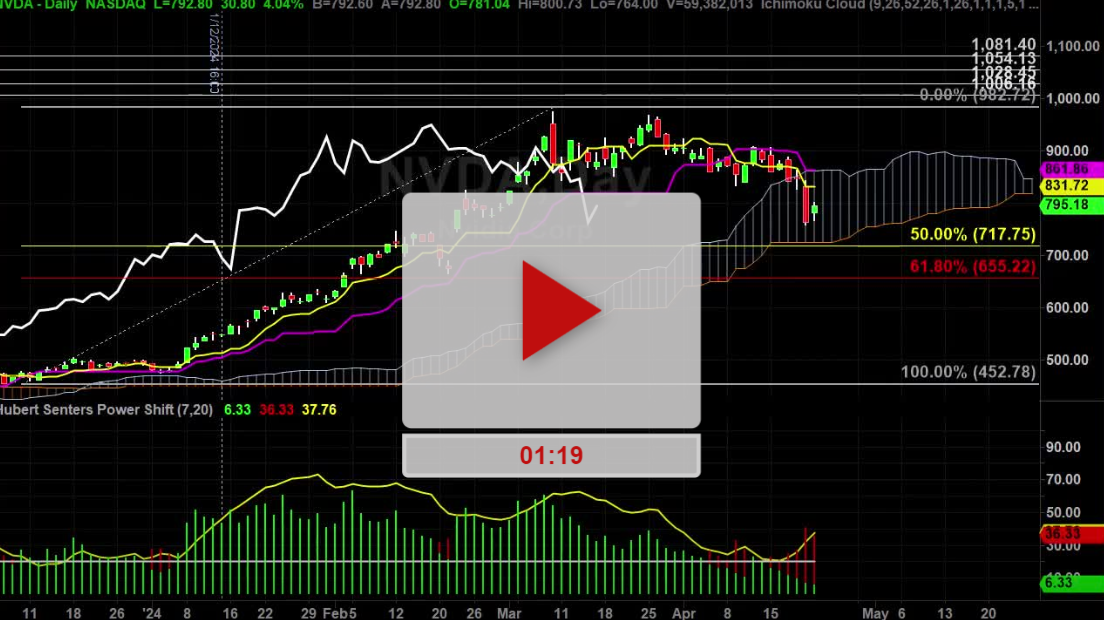
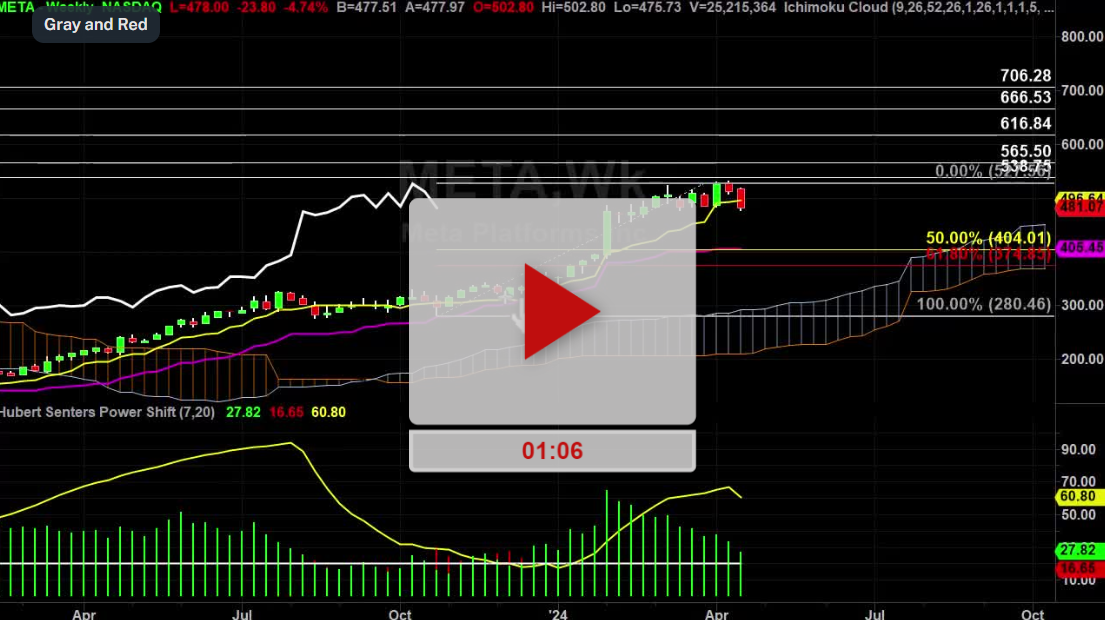
Let’s take a look at Zoom. Obviously, it’s not a buy yet on the daily. But it looks like it’s going to head to $477. It’s in the cloud on the daily.
But if we change that look a little bit. Let me show you how you can sneak in on this stuff. So this is a 10-minute chart.
And obviously first thing this morning the thing jump out of the bed and higher so it did that yesterday and the day before yesterday so.
For three days we’ve had a good buy signal on a 10-minute timeframe right here up, right here up. And I’m sorry we’ve had two not three.
We’ve been up for three days. So there’s one and then two. On a 10-minute signal it’s usually good for four hours minimum. It has developed into something better than that.
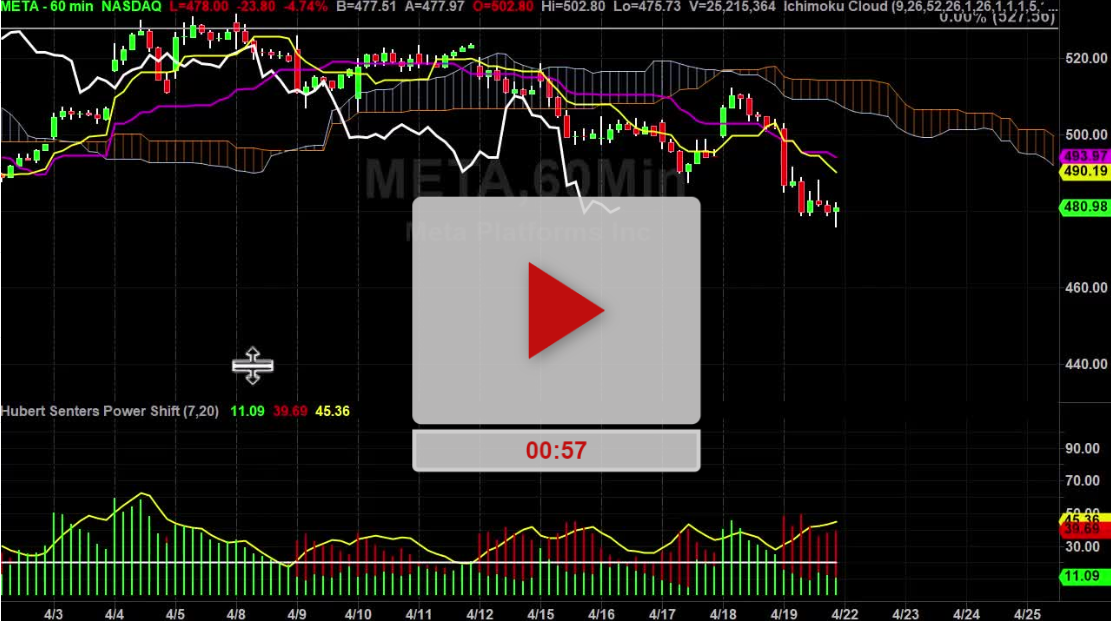
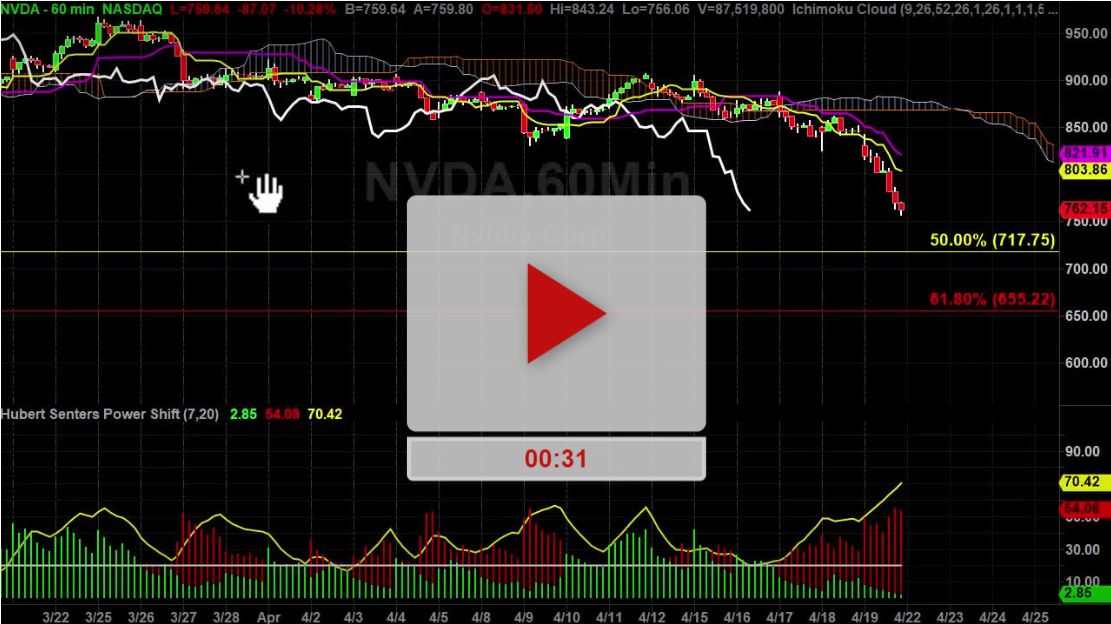
Now, if we change this to a 60-minute chart you can see that the 60-minute chart is now a buy and that usually means you’ll have at least three to five days of upside direction.
So if we now take that in effect and look at that $477 you can probably pull it off.
Good luck. Hope it helps. See you on the next video.
Hubert.
3 Comments
Great commentary on Zoom. Thanks.
Need chart buy sell for amazon
My question is: what time frame chart you use for checking the 60 minutes and 10 minutes price. Please reply. Gloria