Hubert Senters here.
Let’s take a look at an analysis tool that I use as the foundation for all of my scanning that I do initially when I am looking at the market so. I got all kinds of custom indicators and systems and stuff like that.
But I almost always default and fall back on Ichimoku. I wish I would have done the thing. I did not. I am one of the experts and leaders in the field as far as Ichimoku.
It’s a wonderful tool. And I hope you learn how to use it. I will give you a couple of pointers here. Number one it looks a little busy on the chart. I’ve got a course on Ichimoku. It’s one of the bestselling courses out there. I am going to teach you some of the basics really quick on how to use this.
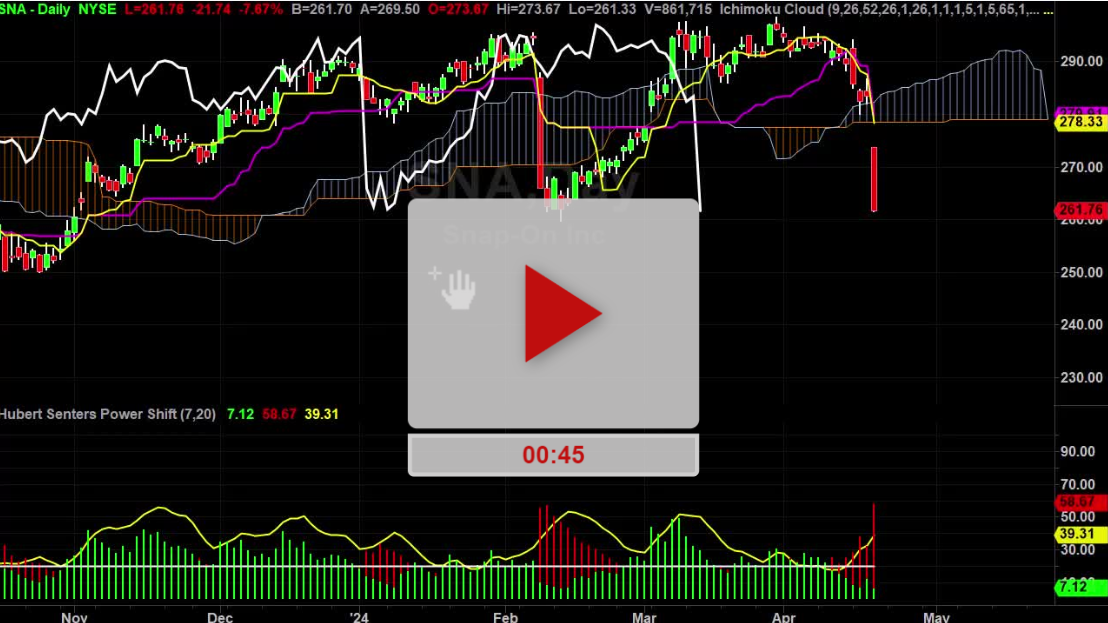
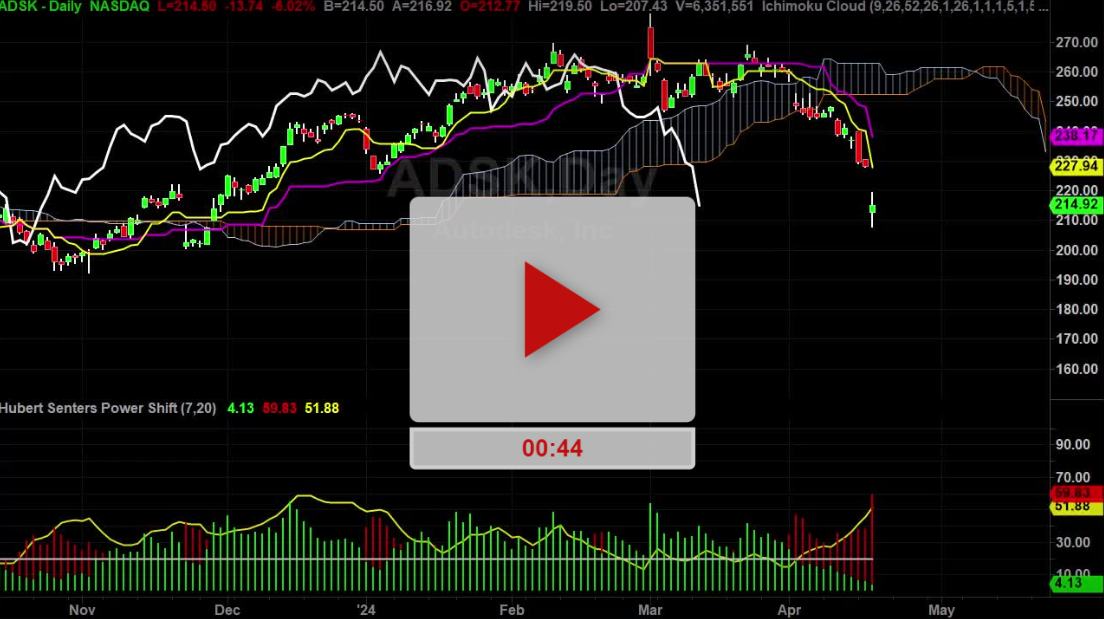
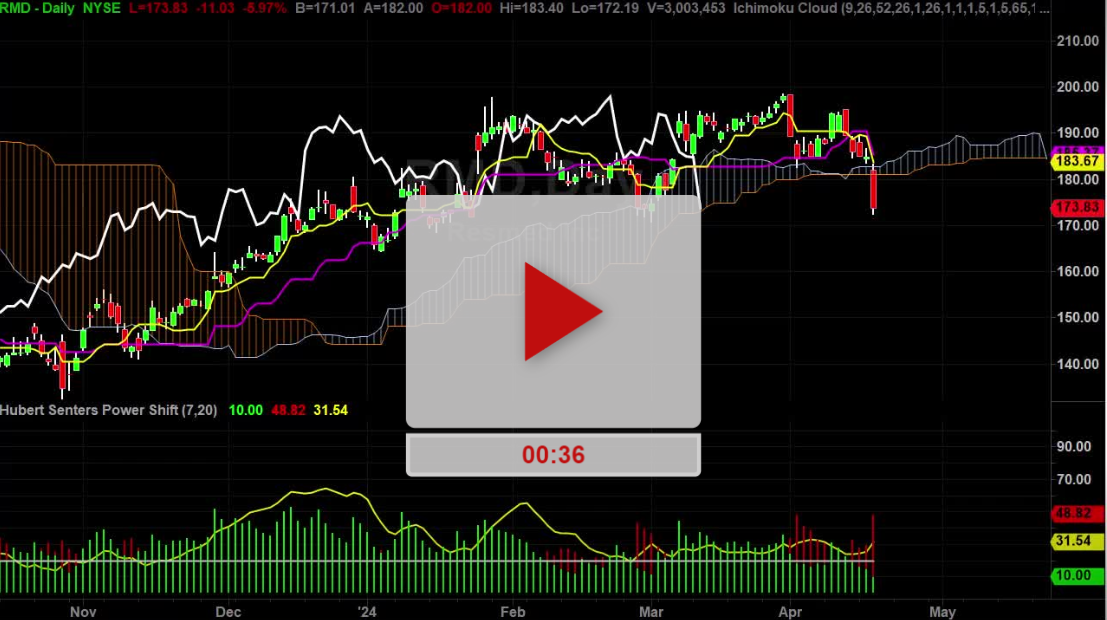
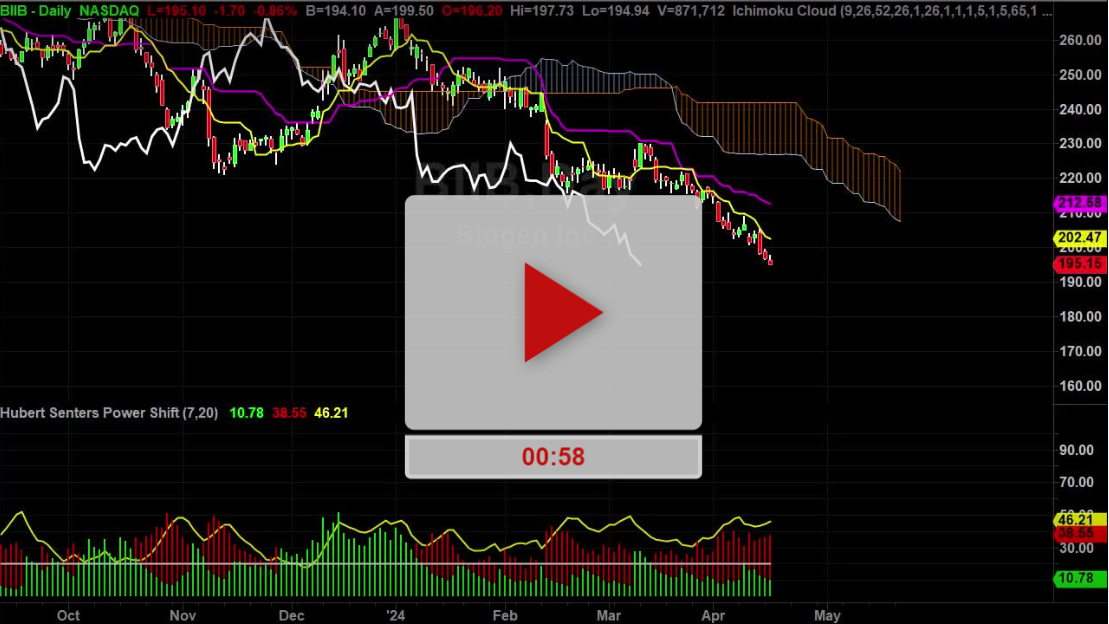
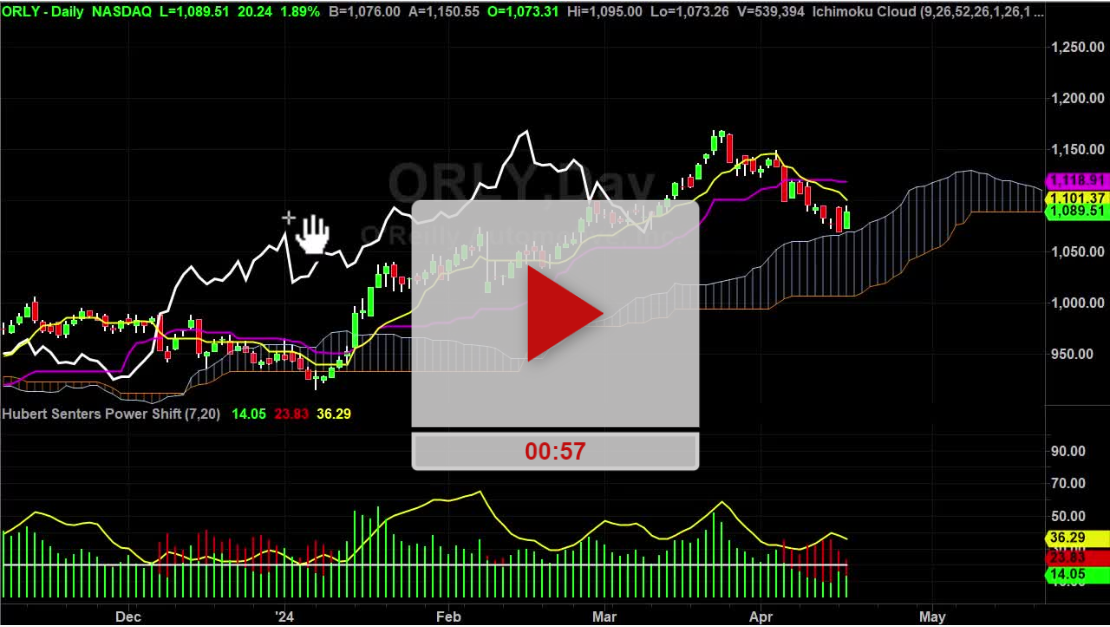
So first, you got to know what you’re looking at. This is a daily chart on Amazon. This little weird thing right here this is called the cloud. And the main theory is if it’s above the cloud you want to basically stay long. If your price action is below the cloud you want to get short so.
I am going to use my little digital ink here so above the cloud here, we want to be long-ish and below here we wat to be short-ish is the theory.
And then this cloud right here you can see the angle of it and whether it’s going upper down that will tell you something to but I don’t have enough time for the video.
So that’s the first thing cloud above it long below it short and then the yellow line it’s called the turning line. And the purple line is called the standard line. And the white line is called the lagging line. Here’s why I love this indicator so much.
And it’s free on almost every platform out there. Here’s why it’s so powerful. This is what happened in the past. This is what’s happening right now to the price action. And this is telling you what’s going on happen potentially in the future so past, present and the future.
There’s not a whole lot indicators that will even give you incline of what could potentially happen in the future. You can use Ichimoku which is what this is. You can use Fibonacci and you can use Elliot Wave. Those are the top three that will do it.
Some of you may not understand what I’m saying when I say Ichimoku or how to spell it so I’m going to double left click here on the indicator and here’s how you spell it, ICHIMOKU.
Ichimoku cloud and here’s the default settings, 9,26,52,26,1,26 and all these other stuff that you really need. And you can make the colors do whatever you want so pick your poison, start using it. I love it.
And I know if you’ll start learning how to use it you’re going to love it too. I’ve been asked to be one of the special guest speakers at the Wealth 365 event. I’m going to be doing a presentation on “How I made $6,281.25 in 10 days risking only a total of $312.50.
A very easy trade to do. There you’re going to be doing a special Wealth 365 where they’re giving away a hundred thousand dollars’ worth of products, services and prizes. I know every one of us are donating a course or an indicator or packages and stuff like that so.
All you have to do is get register now and that will register you for that Wealth 365 Summit event which is going to take place April 9th – April 14th. Just click REGISTER FOR FREE and that will take care of you.
Good luck. Hope it helps. See you on the next video.
Hubert.