Hubert Senters here.
Let’s take a look at the ADX. The Average Directional Movement Index. What this thing does is it tells you whether your thing is happy or sad. Actually it tells you if it’s trending or non-trending environment. It’s great little free indicator. It’s a little lagging like a lot of indicators but it’s useful so I’m going to teach you the basic concepts of how to use this thing.
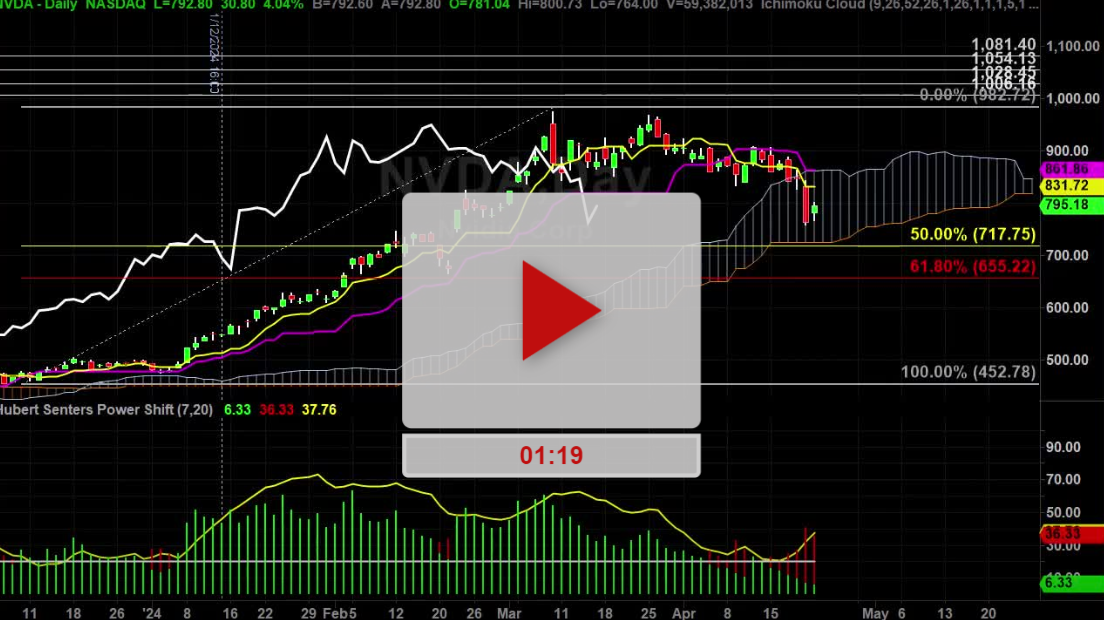
This little green line is called the T line or the threshold line. I have it set to $20. If we are above the $20 if this line is above 20 it will be yellow which tells me that I am in a good trending mode for this thing that I’m looking at in this example is a daily chart of Netflix. If the threshold is below $20 if the line is below $20 it will go from a yellow line to a red line right here in the transition.
And this tells me that the thing that I’m looking at is not in a very trend friendly environment. And I need to leave it alone. Now, just because this in this area right here it’s telling me it’s trending. It can be either trending down or it can be trending up but at least we know it’s trendable all and tradeable.
When it’s like this it’s not the most friendly thing in the world to do. It’s still tradeable although you’re probably going to get stopped out more often than not so I tend to be a little bit more careful when I see the ADX on a daily below $20. I know to keep my powder dry and wait for a better trending environment.
Mark Helweg is going to be doing a special webinar on ‘’How to Profit from Wall Street’s Secret Research without analyzing charts for hours.’’ Thursday, May 16th at 8PM. Read the sub. A little bullet points here. Click this big yellow button here. Register for the webinar. Be sure to show up.
Good luck. Hope it helps. And I’ll see you on the next video.
Hubert.
