Hubert Senters here.
Got another question from Tim.
Hubert,
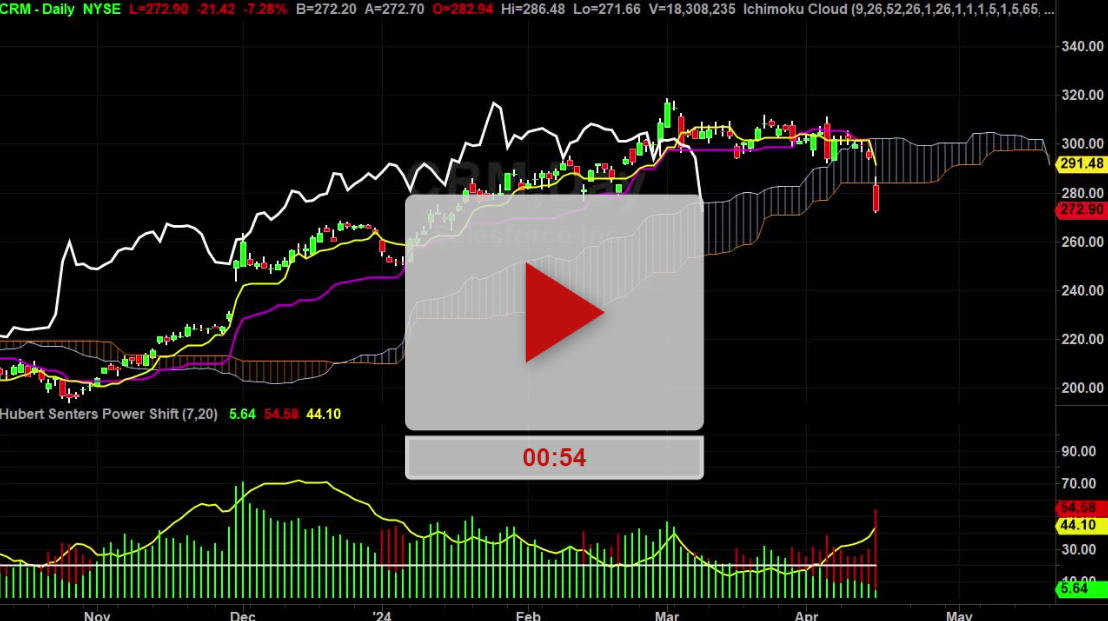
I was wondering if you ever combine the Ichimoku cloud with other charting algorithms. Yes I do.
In particular he’s saying he uses the Bollinger Bands. Bollinger Bands are fine.
I plot both Ichimoku and Bollinger Bands together and have noted a trend that helps me determine within a stock is likely to go on a short term run up as I tend to trade a lot of options.
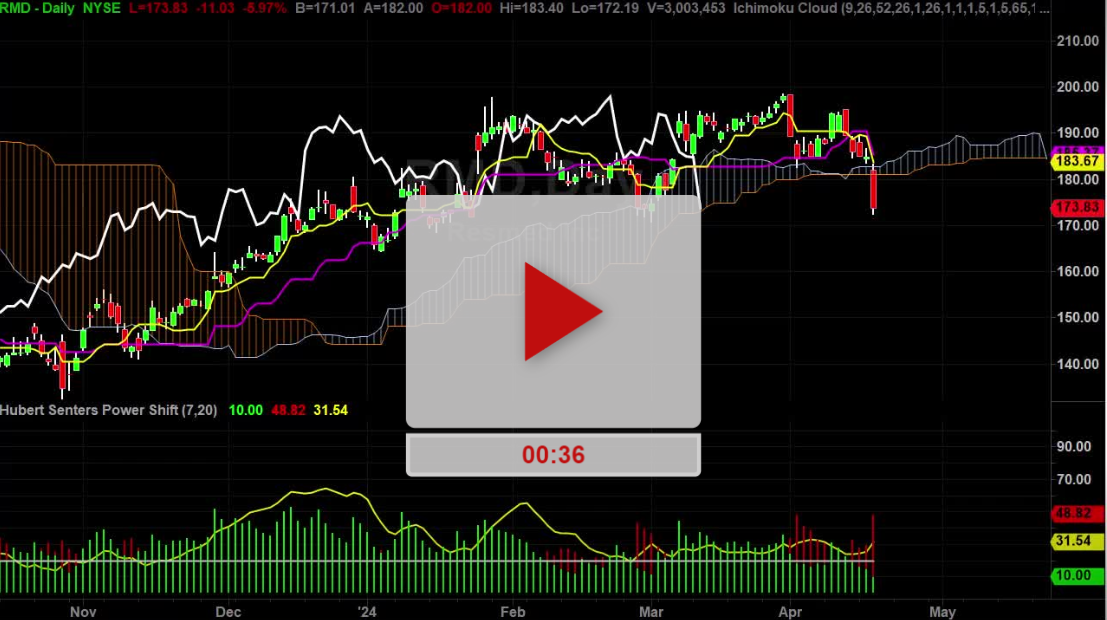
If a stock price dips below the midpoint of th Bollinger Bands (20dma), and then immediately pops back above the midpoint, then it is likely heading back to the top Bollinger Band. As I look at NVDA this certainly looks to be playing out. Tim Schremmer.
I have plenty of other proprietor indicators that I use. They’re usually developed by a good friend of mine, business partner Mark Helweg because he’s always got ideals and he’s always tweaking stuff.
Here’s what you’re talking about. You’re talking about a pullback. So your mid-line on the Bollinger is the white line and for me in order to keep it simple if I didn’t want to use the Bollinger and that’s how I do it is it goes to the standard line.
And with the test of the standard line then closes above the turning line then I know I’m good to go which is basically the same thing that you’re doing here. We’re just doing the same thing with slightly different approaches is what we’re doing.
But yeah, I tend to keep the videos kind of short into the point and not have a ton of different stuff because I don’t want to confuse everybody that’s on the video but I have all kinds of proprietary indicators that I use for trading that we will showcase in our courses or when we try to sell indicators.
But for the free videos and stuff I keep it nice and simple into the point really easy to understand for the general public that may or may not be really versed in a lot of high end trading algorithms and proprietary indicators and stuff.
And a lot of times as an evolution of a trader what should do is you’ll start that with a chart that has no price action on at all to look like this. You have a chart that’s just a picture of that right there.
And it will just be a candlestick chart of some time frame. And then what you do is try to crack the code. You start adding a bunch of indicators and then it gets to the point where you can’t even see the price action.
Then overtime what you’ll do is you’ll say is this helping me or is this hurting me with a decision?
And you’ll say is this indicator is doing the same thing that this other four doing is slightly different, I’m just going to consolidate the one. But yes, I use several other different proprietary indicators for setups and I think what you’re doing with Ichimoku and Bollinger Bands makes good sense.
You might want to checkout Donchian channels and try those two. They are similar to Bollinger Bands. They are a little bit more strict where Bollinger Bands will expand and contract with the vol and the Donchian channels are a little bit strict so try those you might like those two.
You can also try Keltner channels which are kind of the same thing as Donchian channels. They’re real close. Mark Helweg is going to be doing a special webinar ”Finding Explosive Trades with the SVS Strategy…How To Find Trades Like a Sniper!” Wednesday, July 29th at 8PM EST.
Find a high quality trading strategy. Scanning markets for buy and sell signals. Verifying signals with Power Setups. All designed to put the odds in your favor. That’s Wednesday, July 29th at 8PM EST.
Good luck. Hope it helps. See you on the next video.
Hubert.