Hubert Senters here.
Let’s cover this question on Ichimoku. Now, heads up I’m going to be doing an Ichimoku lesson. Friday I’ll be over at the Wealth 365 and I’ll hyperlink to the registration page. If you have questions about Ichimoku and in my opinion the proper way to use that thing come over and check it out. But let’s check this question out.
With regards to ”the cloud” the ”future” portion of the cloud extending to the right, please explain exactly what that represents, ho to use and interpret it and do the levels indicated by the upper white line and the lower orange line suggest future price levels or something else?
Let me move this up onto another screen. You’re talking about upper and lower bounce. Usually how this is calculated. Now, I used to teach a class on Ichimoku 101 on how to do it. And now I sell a course on Ichimoku Cloud Charting Secrets. I would have to refer to my notes just because I’ve got to teach myself how to do it.
I keep notes on it. From my notes if it’s the cloud what you’re taking is you’re looking at a range of the bars. Let’s say 52 bars. And then you’re taking a mid point of that. Let me go grab my notes. It’s not going to be pretty but it is going to be effective.
So in this situation right here Cloud Span B. Midpoint of high and low of the last 52 sessions shifted forward. If we advance the slide. Click. And what we would do is we’d take. And this would be the starting point. That would be 52 bars. That would be the midpoint and you’re going to forward project top of the cloud. Where the other one is the turning line and the standard line midpoint projected future shifted 26 bars. That’s that one.
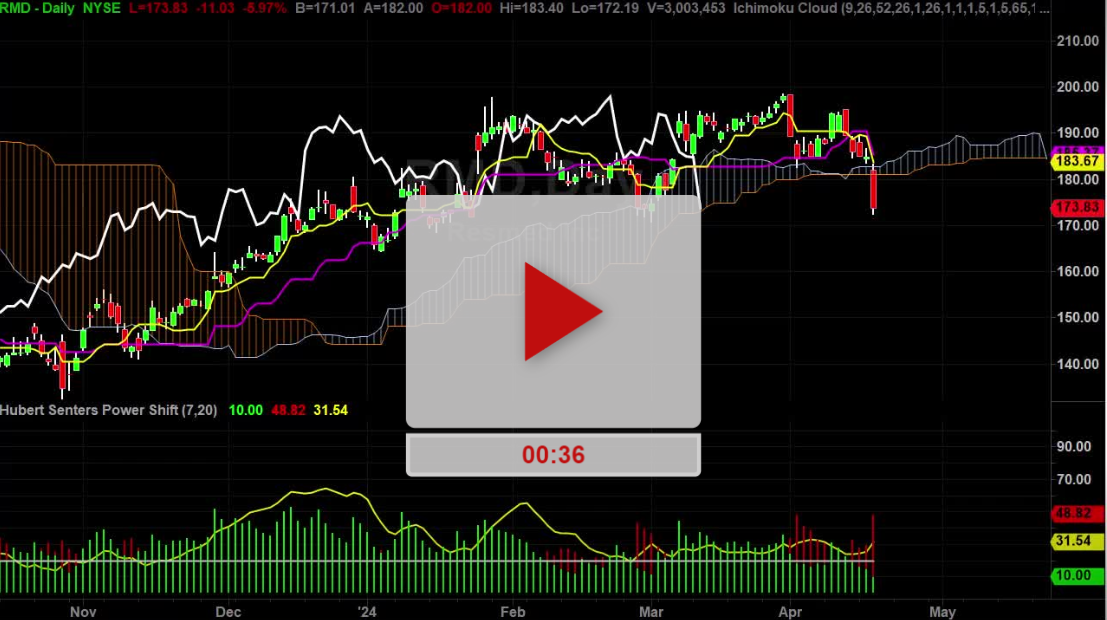
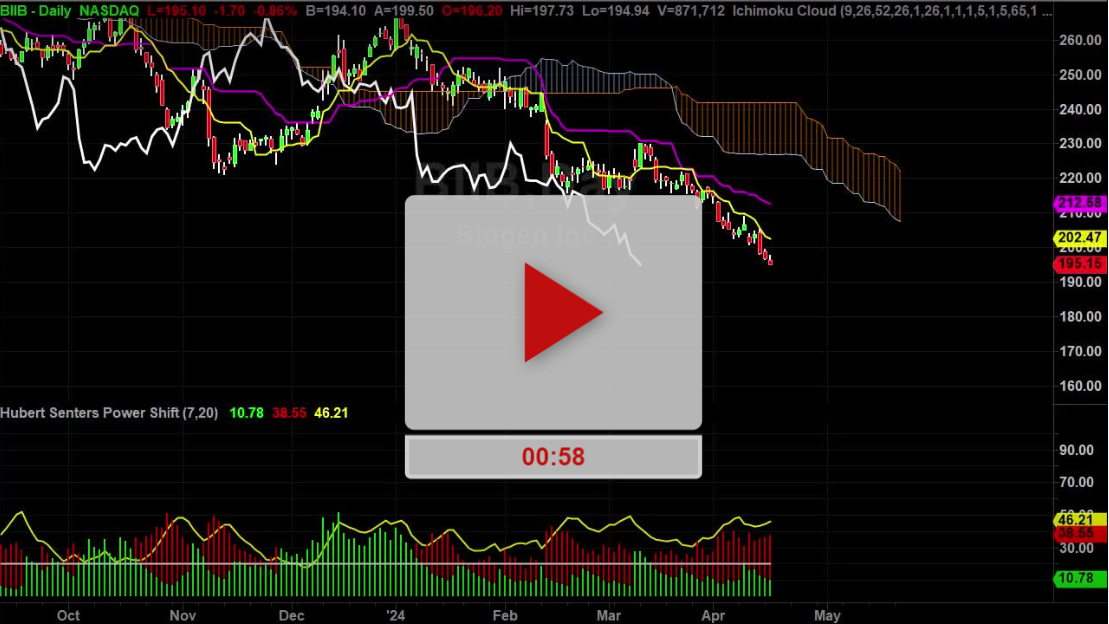
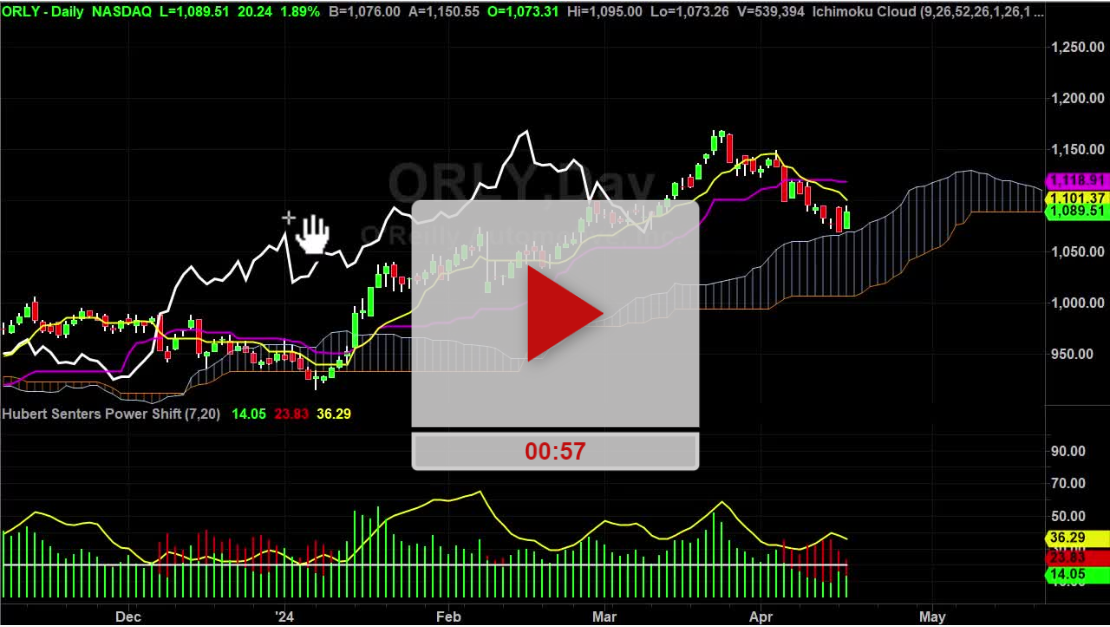
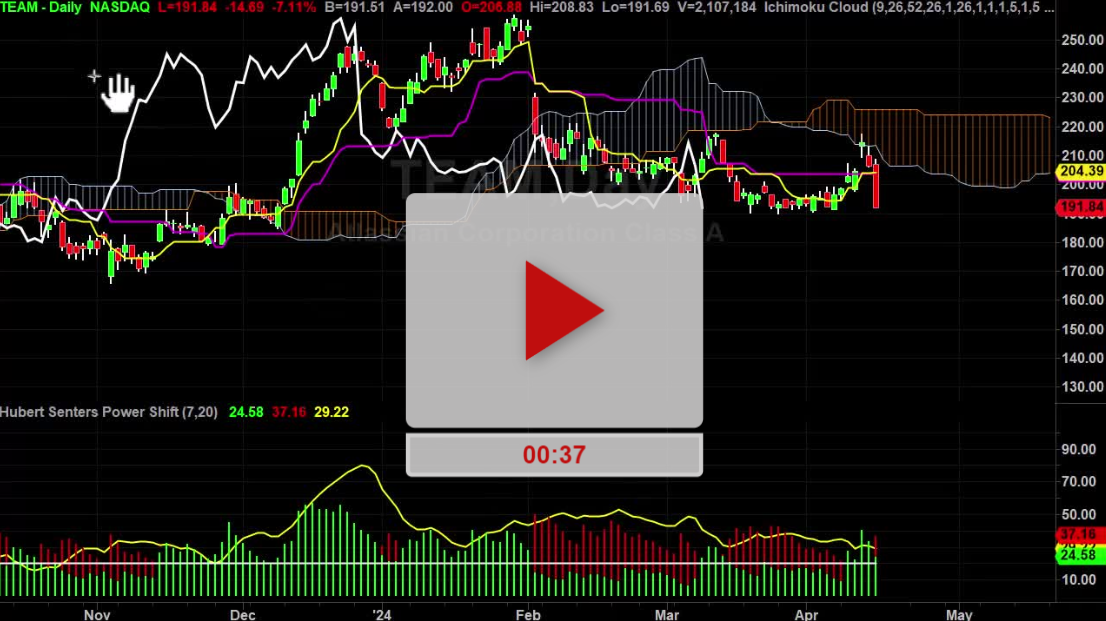
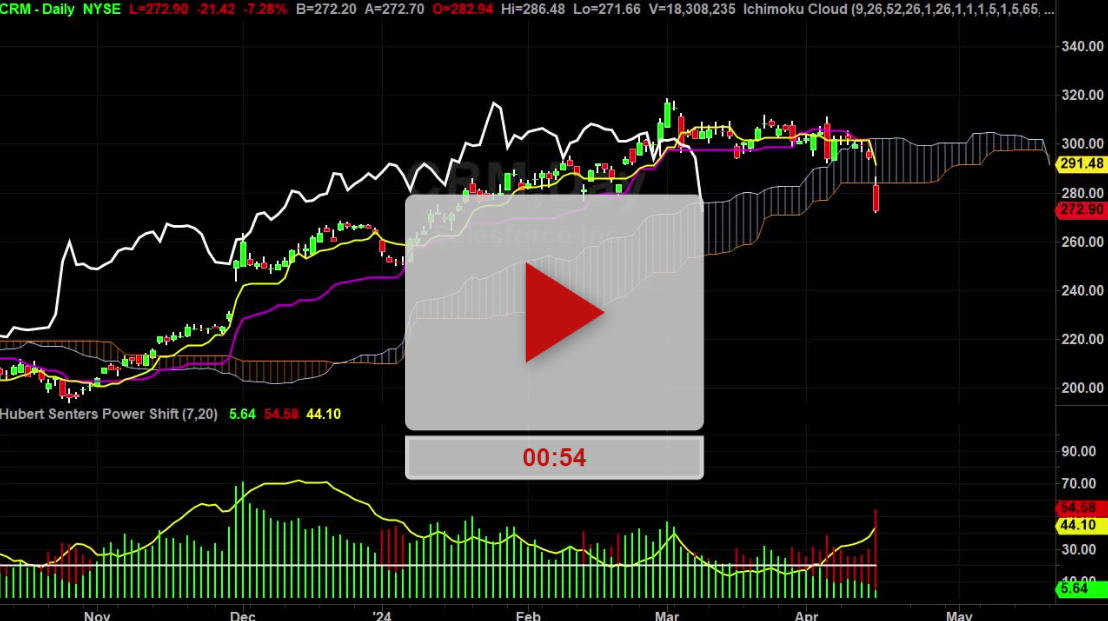
The other one is going to be Span A and B. It depends on the flipflops. That’s how it’s doing. Now, when you’re talking about that’s how it’s calculated. What I look at is the slope of this thing so right now Tesla is non-trending according to the ADX
and the slope of the cloud is somewhat slide ways with a little bit of ramp to it.
Now, if you compare Tesla to Corn. You can see that the angle of the cloud is telling you it wants to go higher in the future.
Where the Tesla wants to go hey, I’m trading sideways. That’s how I use that thing. The lagging line lags price by I think 26 bars so that’s the past price action. That is useful if you cross above the cloud and you’ve got the line that cross with you
Or you cross back below the cloud and the line goes with you. It’s kind of like a confirmation setting. Hopefully that helps.
I’m going to HYPERLINK you to the Wealth 365 registration page where I will be going over this in more detail
because I’ll have an actual hour to talk about it instead of 3 minutes.
Good luck. Hope it helps. See you on the next video.
Hubert.