Hubert Senters here.
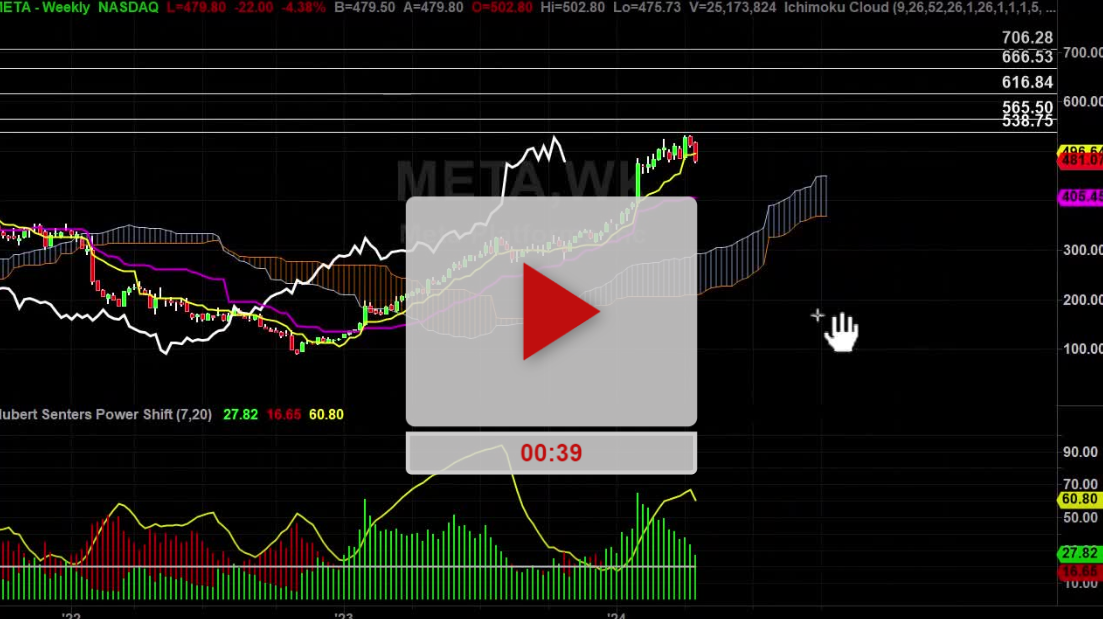
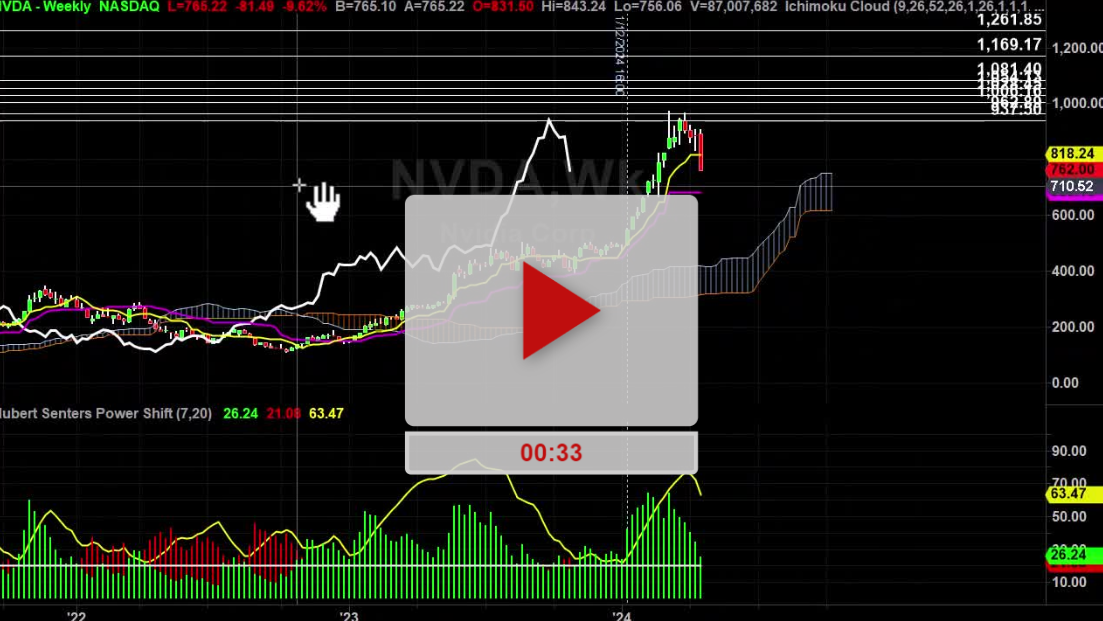
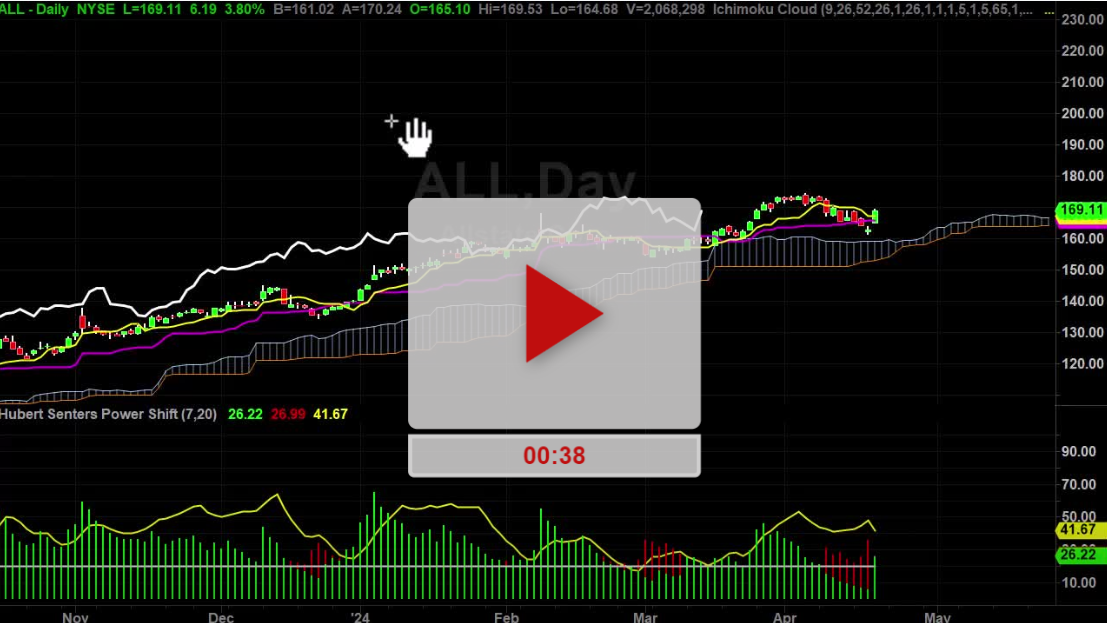
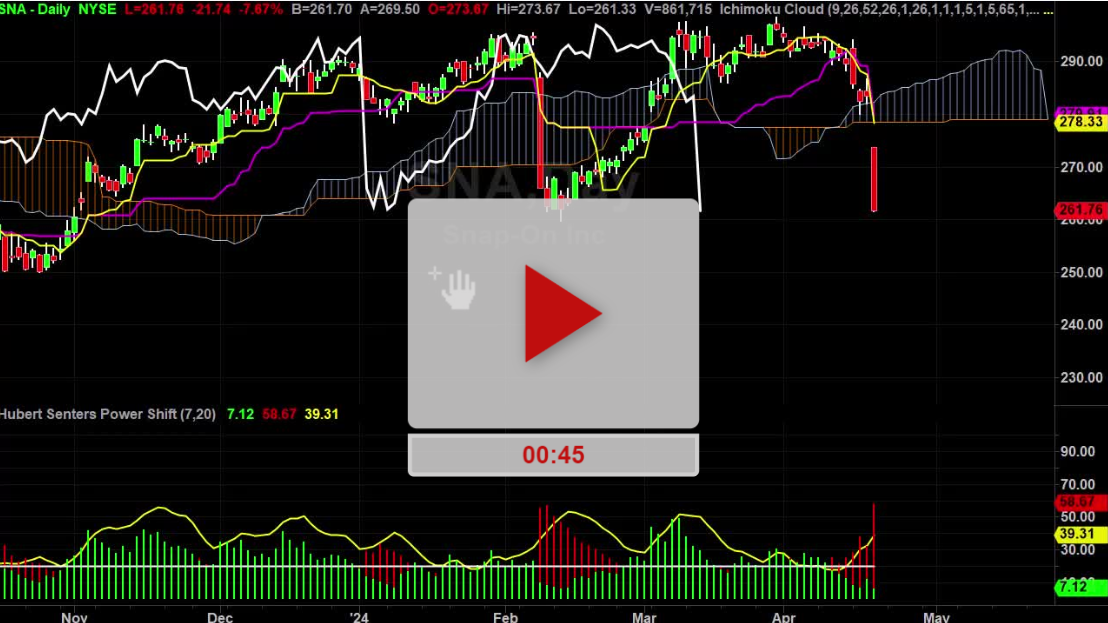
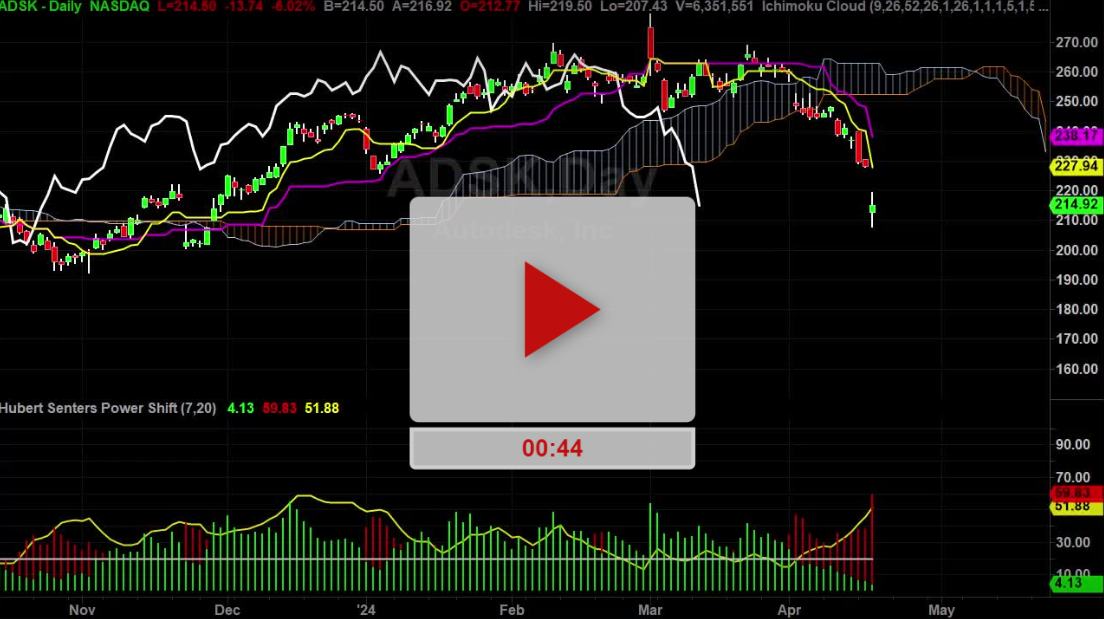
On the last video, we were talking about the importance of using Ichimoku to stay long above the cloud or short below the cloud. Also describe to you really briefly what the colored lines were on the chart.
Now, if you want to save yourself a lot of time, learn how to effectively scan with whatever tool you’re using. In this example I’m using trade station. You can also do the stuff with thinkorswim or toss. So this is called radar screen. Toss has its own built in scan that’ll do basically the same thing.
I’ve got the S&P 500 and if I just double left click here you can see this is above the cloud it’s going to say AAP scan. It is above the clouds bringing above cloud one, two, three, four days. And these are all above.
Maybe I want to scan just for the new above or below the cloud double left click. Now, this is going to tell me these are newly below the cloud and that’s a new above. So we’ve got more new aboves than I do belows. Let’s check and make sure it’s accurate.
COL new below the cloud. That works. ABT new above the cloud. That works. So you can see how I can scan through $500 equities real quick and you can see it ranks about if I’m going from what I started at $70 down to about $116 so $20-$30 stocks that I scan and all out of $500. I’ve got about $20 or$ 30 that are newly either above or below the cloud.
Now, I’ll use one more filter criteria to make sure it’s trending well forming. So I’ll talk about that in the next video.
Good luck. Hope it helps. I’ll see you in the next video.
Hubert.
