Hubert Senters here.
In the last video, we’ve talked about using the ADX to let us know something is trending or non-trending then it will fix just half the problem.
I still use Ichimoku to let me know if I am above the cloud I’m probably trending higher and if I’m below the cloud I’m still probably going lower.
So in this example, we’re looking at Tesla. This is going to be the avoid when this red line drops below that green line and I’m just going to leave that alone right now.
As you can see right now Tesla is trading sideways and it’s non-trending but you can also see in this chart that it was the ADX was above $20 here.
And it went up. And then it also went down. It’s still trending though. It’s not sideways. But then it only fixes one of the problems.
Now, what you need to do is you need to figure out not only if it’s trending the direction and you need to decide and figure out to do some Math and figure out who’s in control the bulls versus the bears.
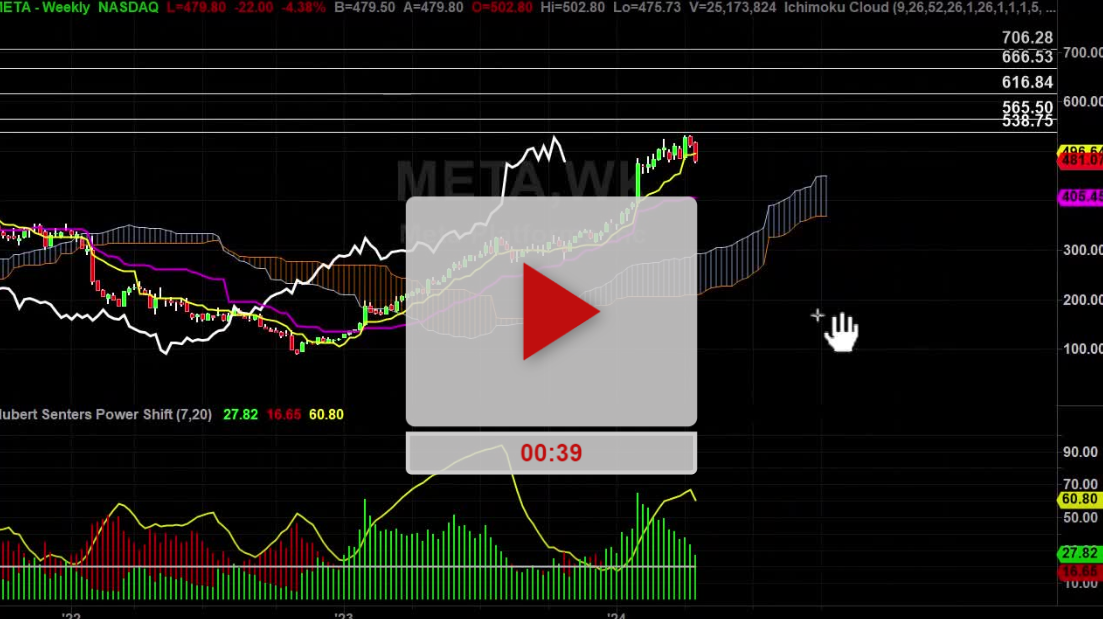
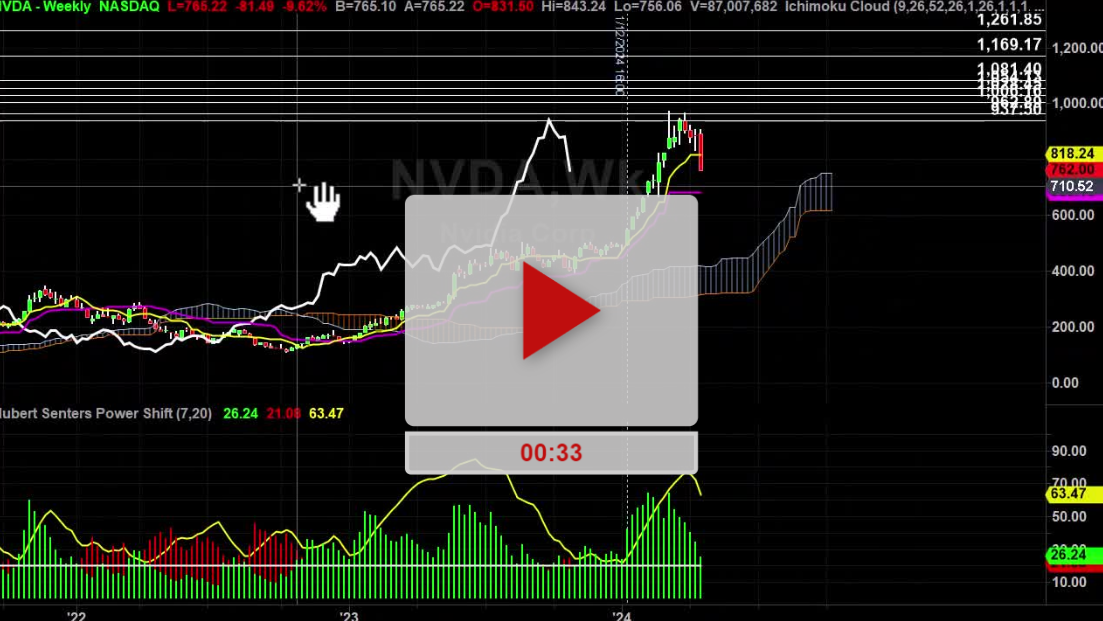
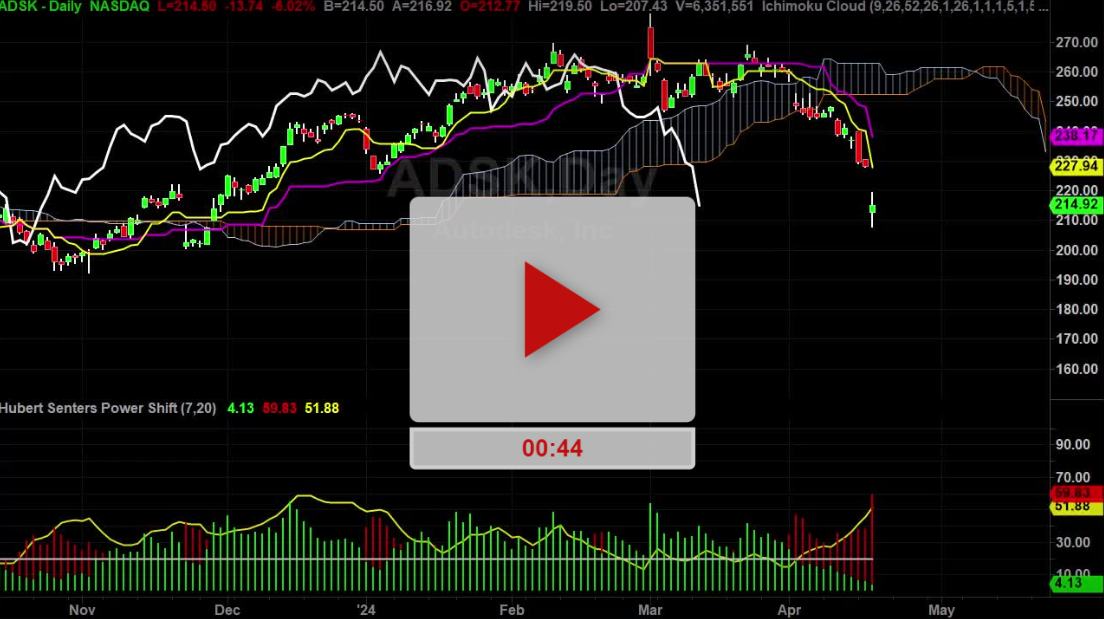
So as you can see I’m using a slightly different chart. Now, this is Tesla and I’ve got the power shift down here.
And this is going to tell me number one is it trending yes or no so same basic tool but just a little bit more information now.
So if I look here the ADX reading is below $20 which is telling me leave Tesla alone. It’s trading sideways. If I trade it I’m probably going to lose money.
In this example, it was trending and the bulls are in control. And then if you go back here a little bit. I’m going to remove my ink and go back here.
And then you can see right here it’s trending and the bears are in control. So let’s try it with something else. Let’s say Starbucks like we’ve looked at it earlier. SBUX.
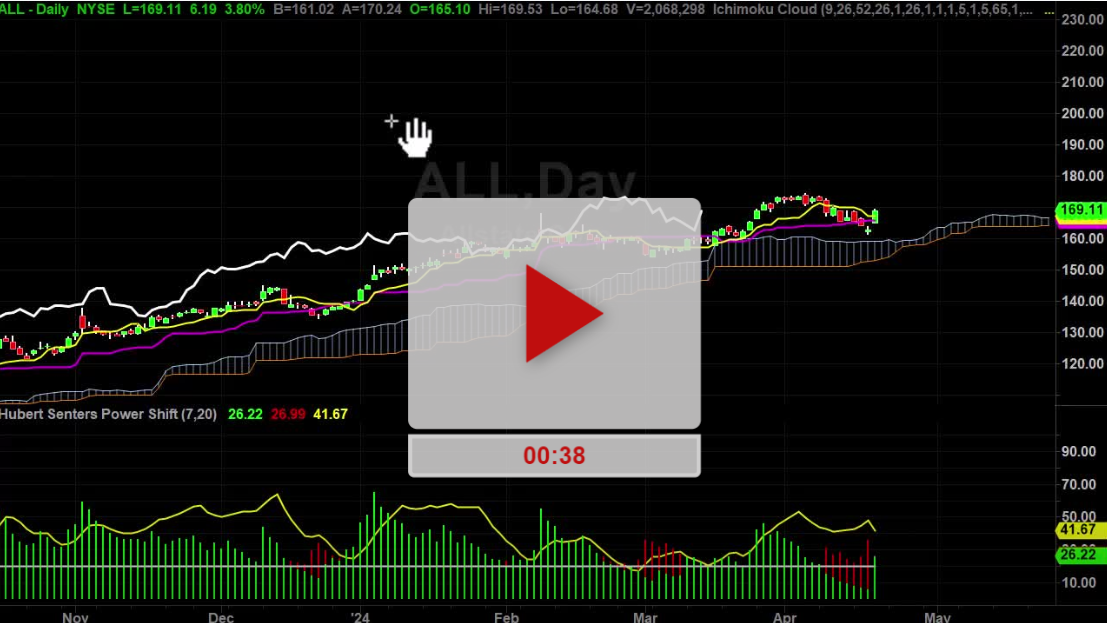
It’s trending because the yellow line is above the white line at $20. And the bulls are in control. So I’ve got a good shot of making money as far as the probabilities go.
If I’m long Starbucks as long as it’s trending and the bulls are in control. And I know the bulls are in control because the green is on top.
Now, in this situation back here if we look at Starbucks I know I should leave this thing alone when the ADX is below $20.
Right here, this whole time right here I should leave it alone until it creeps its head right above and goes hey, I’m trending and now I’m going up the bulls half control me.
Here you have bulls, bears, bears, bears, bulls. And it’s non-trending so I should leave it alone. And then in this example here once again gets trending and the bulls are in control.
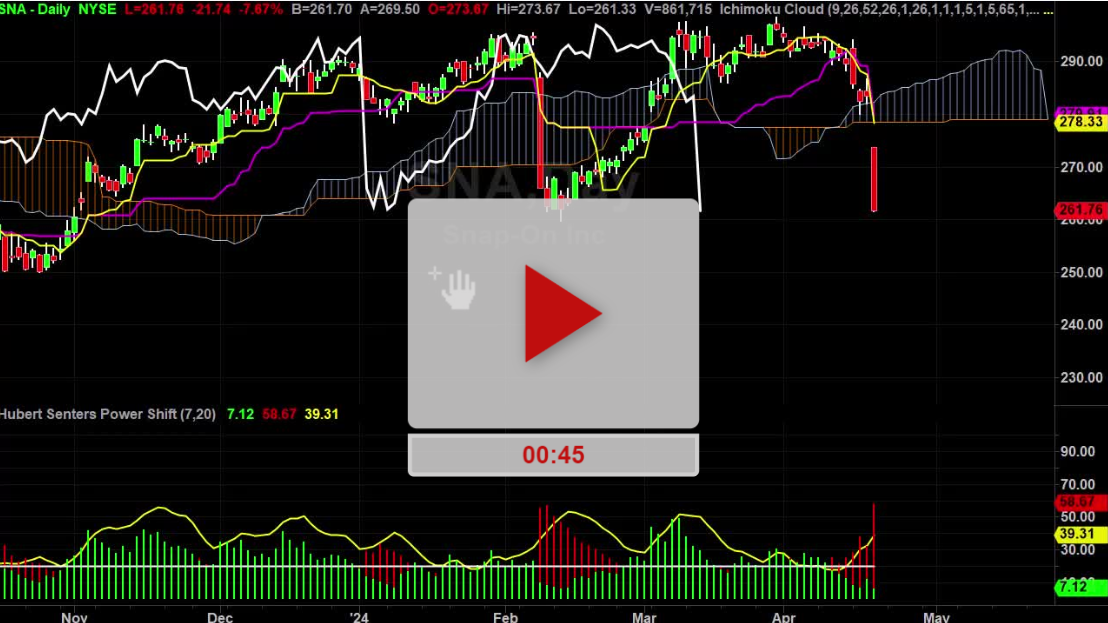
Really good tool to help me know not only the direction but who’s controlling the direction. I know if I’m trending the ADX is going to be above $20.
And then I know if the greens on top the bulls are in control. If the red is on top the bears are in control and it’s a really useful tool for helping me time tops and bottoms which I’m going to show you in the next video.
Silas Peters is going to be doing a special webinar on Price Actions Secrets To Follow The Big Money Footprints.
They’ve got one that’s happening right now at noon while I’m recording this video. After the one that happens at noon today they’ll update that and it will be the right date.
It’s July 27th Tuesday at 2PM EST. In order to register for the webinar all you got to do is click this button right here just CLICK HERE TO REGISTER.
Little pop up is going to get you. It needs your first name. It needs your primary email address. It needs you cellphone so we can either voice call or text you and go hey, webinar starting in 15 minutes.
Good luck. Hope it helps. See you on the next video.
Hubert.
Hi Hubert,
Have you considered putting the Power Shift on Wealth Charts?