Hubert Senters here.
Let’s take a look at a question from a viewer. First, I’ve been trading for a few year but have so much to learn. Thank you fo what you do.
Question: Could you slowly go through how you pick your stops? I need to stop the bleeding.
I’m not actually allowed to give individual tailor investment advice to individuals because I don’t know how much money you have in your pocket.
So my risk level may be different than your risk level. And your risk level may be different than your neighbor’s risk level.
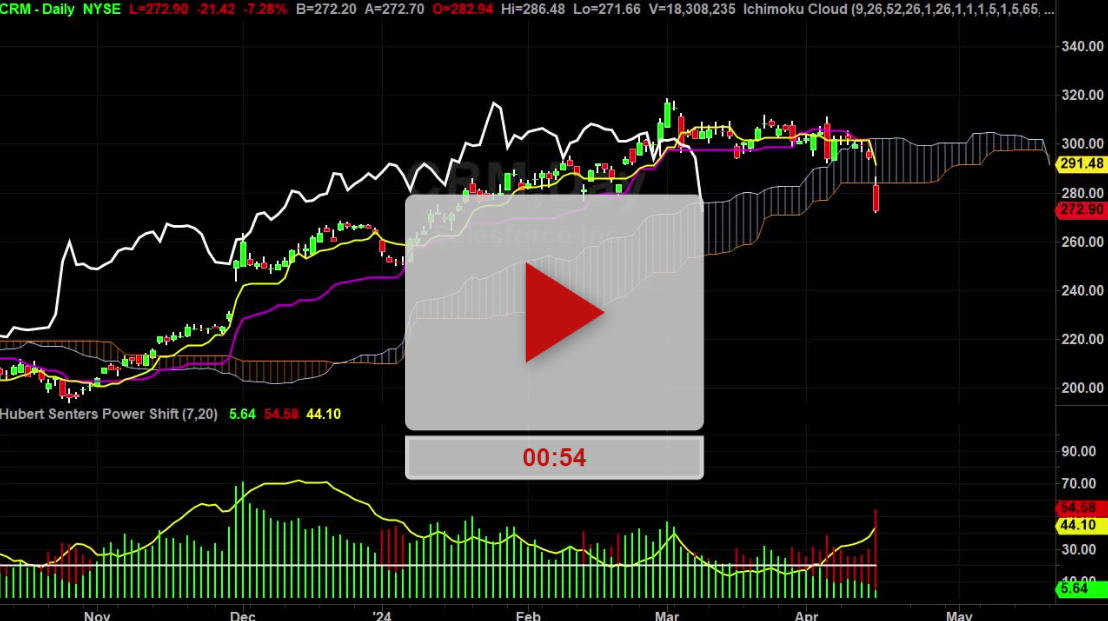
But I will walk you through a FREE tool that you can use to kind of make it a systematic as possible. Let’s go take a look at a chart.
So the first thing in this example regardless of what your stop is. It is my humble opinion that you should always use really good risk reward ratio.
If you’re going to risk a dollar you should be trying to make $3, $5 or $10. So you wanted a 3X, 5X or 10X. Whatever multiple your comfortable with.
But if you can dial in your risk reward ratios the stops are not going to matter as much as the risk reward ratio.
But that means since stops are very important so first I want to find something that’s in a valid uptrend because everybody is just easier to teach them or think about long versus short.
So here we got CME. It’s above the cloud. Everything looks pretty decent. It’s trending. It’s up so I’m going to remove this from the chart and just make it blank.
Then what I want to do is put an indicator on here called PAR SAR which stands for Parabolic SAR. We’re going to pretend that we went long today at the close at around $205.80 right there.
I’m going to go right click. I’m going to go insert analysis technique and then I’m going to look for PAR SAR and then I’m going to hit ok.
Now, usually these dots are super small so I’m going to style this and make it really thick so I can see those suckers and then hit ok.
So the way you use this if we were long at $205 it’s recommending a stop of $191. I don’t know about you but that’s way too thich for me.
As too rich for my blood I wouldn’t want to use a stop if my entry was $205 all the way down to $191. That’s a little bit too wide for me.
So what you do is you go back it down, you go ok that’s a daily chart. What about a 60-minute chart? On the 60-minute chart it’s a little bit different here.
It’s saying that we should be short so I’m going to change it to 240-minute chart. There we go. Now, on this one I can kind of live with that.
If I’m be in it $205 I would be willing to risk 5 bucks on the CME to see if it’s going to go higher. Now, also if I’m going to risk 5 bucks I want to make at least three times that’s we’re going to go for 15 points.
And that’s kind of the exercise that you have to go through and everything’s got a little bit different personality like CME is going to be way more volatile than like Micron or Intel or Walmart or Tesla and Apple and stuff like that.
So what you have to do is just dial it in and you can always curf your stop to parabolic SAR. And it’s really good to let you know how to properly trail a stop but you have to do the homework.
First to go ok, I’m ok with that risk. And then once you decided you’re ok with that risk then you can start trading that and see what happens.
Tiger Shark Trading is doing a webinar. It looks like March 4th at 5PM EST which is tomorrow. How to Trade Breakout Stocks for a Living with Dave Mecklenburg.
I’m going to HYPERLINK you to the registration page in case you want to go over and check it out.
Good luck. Hope it helps. See you on the next video.
Hubert.