Hubert Senters here.
Got a question from a viewer. Michael wants to know.
Hubert,
You provided the target zone for GM.
What I really want to know is when I look at the chart can I make a determination to BUY based on chart candle positions without doing a Fib?
A lot of us old traders we were kind of winged on just trading either price action with no charts, bar charts, diamond close or you can just an entry on a candlestick. You can definitely do that.
I believe you do a Fib for targeting. Yeah it’s useful.
But is this process used to determine a strike price or just possible movement?
Just a possible movement but I’m sure that you could probably reverse engineer and get close to a strike price if you want to do that if you’re an options trader.
I am always trying to determine whether to buy a stock from the Ichomoku chart. I guess it’s nice to know how a target but I just need to know if Ichimoku is a process showing stock potential because it seems I keep losing.
If you continually lose my recommendation is simplify. Simplify and trade one market one stock. It only have two or three set-ups on that thing and get really good at those and then you can expand.
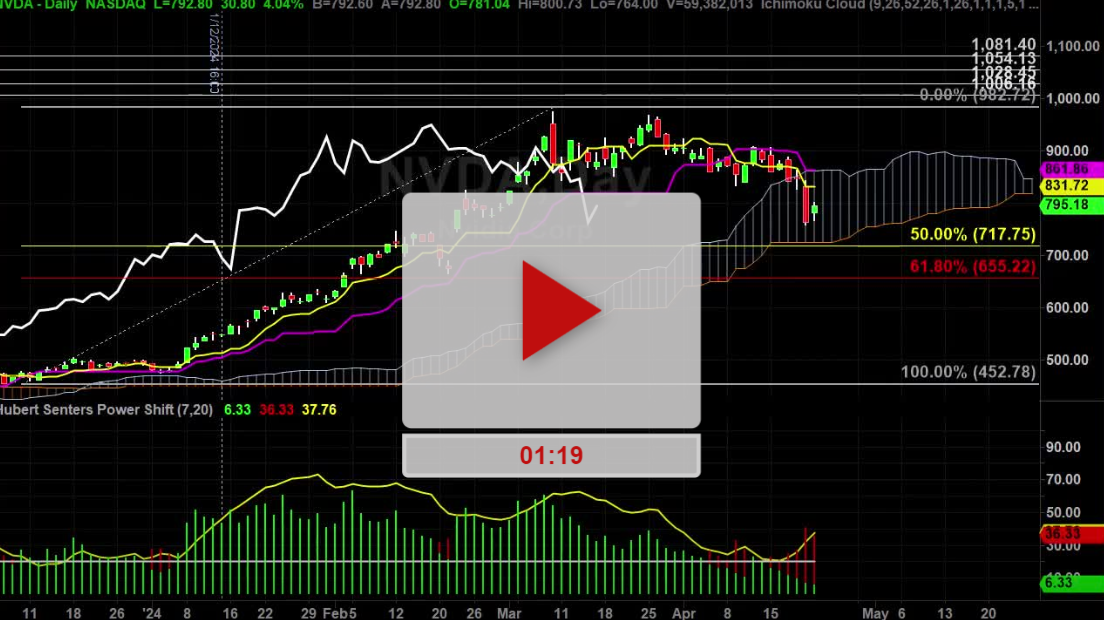
Let’s take a look at GM really quick. Let’s go to GM. In Ichimoku what I’m looking for here on a daily chart is I’m looking that it’s above the cloud for one to three days and then will get long in that situation.
Now, the cloud won’t give me a target on the situation unless I use an extremely larger cloud formation.
So in this example, I try to think how I can answer. If I get a 10-minute buy signal i can use a 60-minute cloud as a target. Let me show you how that would work so it will be a little bit confusing but not too bad.
So back in here where it gap up. It’s a terrible example but this is a little bit better one.
If I had a 10-minute buy signal and jump above the cloud and then on the 60-minute cloud there was overhead resistance so in other words this would cause a 10-minute buy her and the target would be on the 60.
So this is a 10-minute and this is a 60. So if I got a 10-minute buy signal that was below the 60-minute cloud I would then use the cloud as the target.
It’s not a perfect example but that’s how you would do it. I think fibs or just risk reward ratios are good for targets too.
Let’s see if we change this to a monthly chart. So we don’t have anything above the cloud and then you could go yearly if you want to do yearly chart on that too and you could do it that way.
I hope that helps answer your question. I hope that didn’t confuse the shit out of you.
Good luck. Hope it helps. See you on the next video.
Hubert.
